- Naranj Research Desk
- 🇸🇦 Saudi Stock Market
- 🇺🇸 USA Stock Market


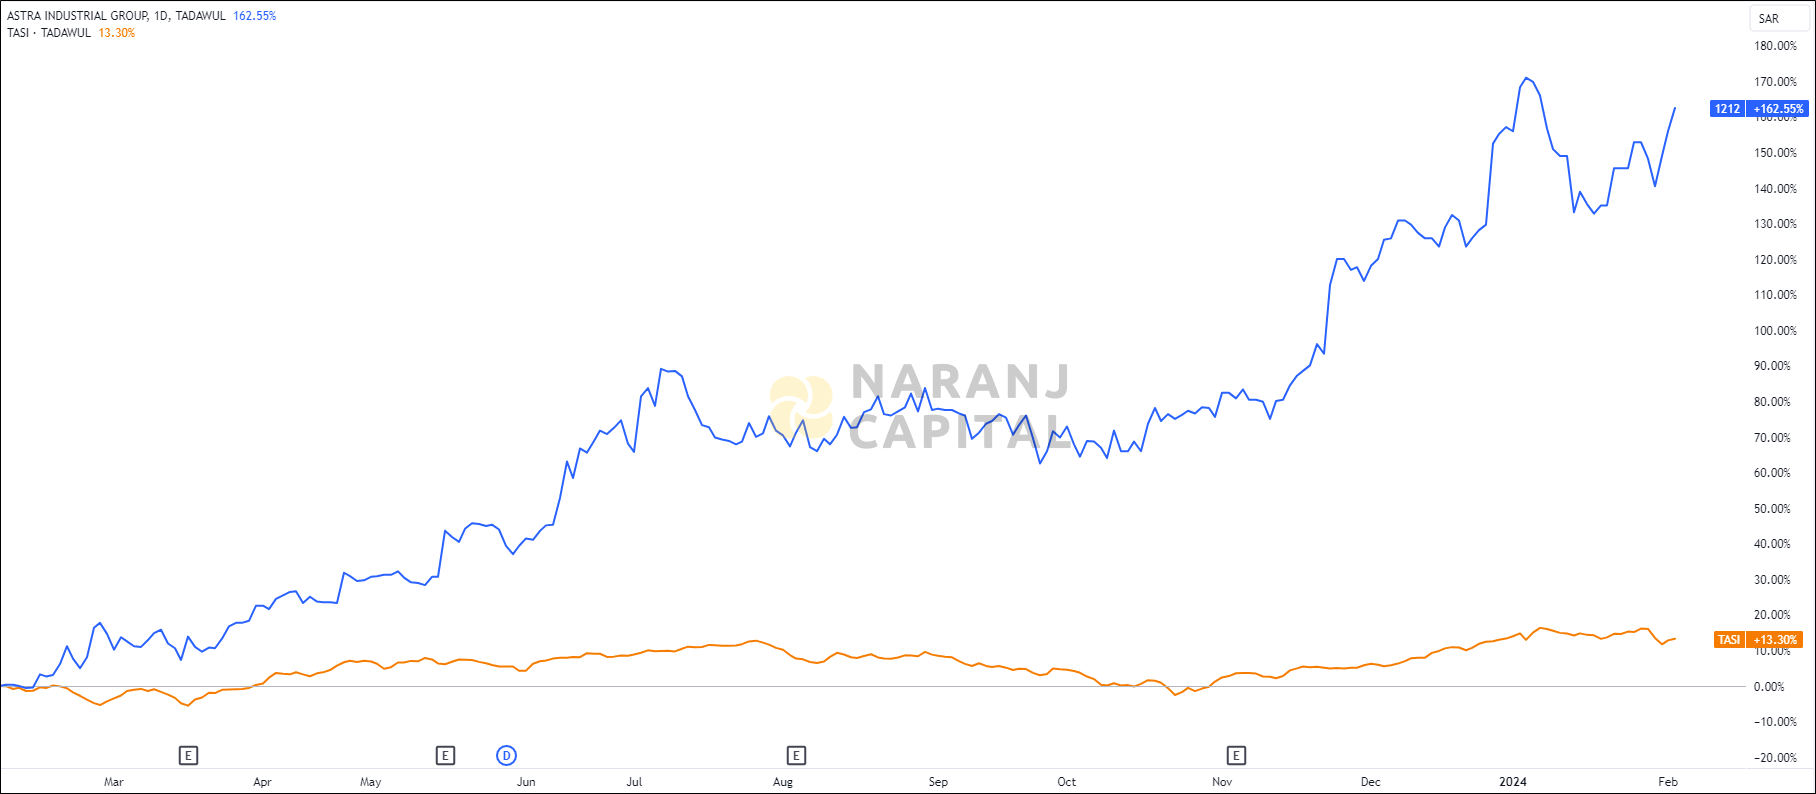
ASTRA INDUSTRIAL — TASI —
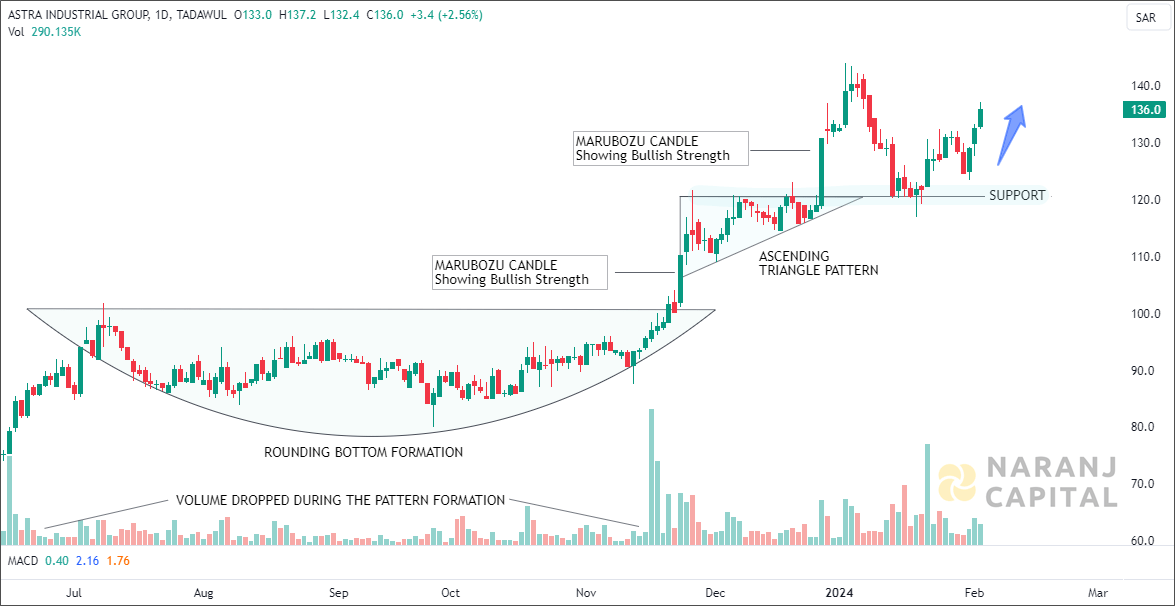

The current RSI of this stock is 63.64, which indicates strength.

Increasing ADX value above 20, indicated the strength of the trend, thereby uptrending ADX confirms the bullish or bearish supportive decisions. Along with the rising ADX, and the +DI is above (or crossing) -DI, indicates the long trades should be favoured.
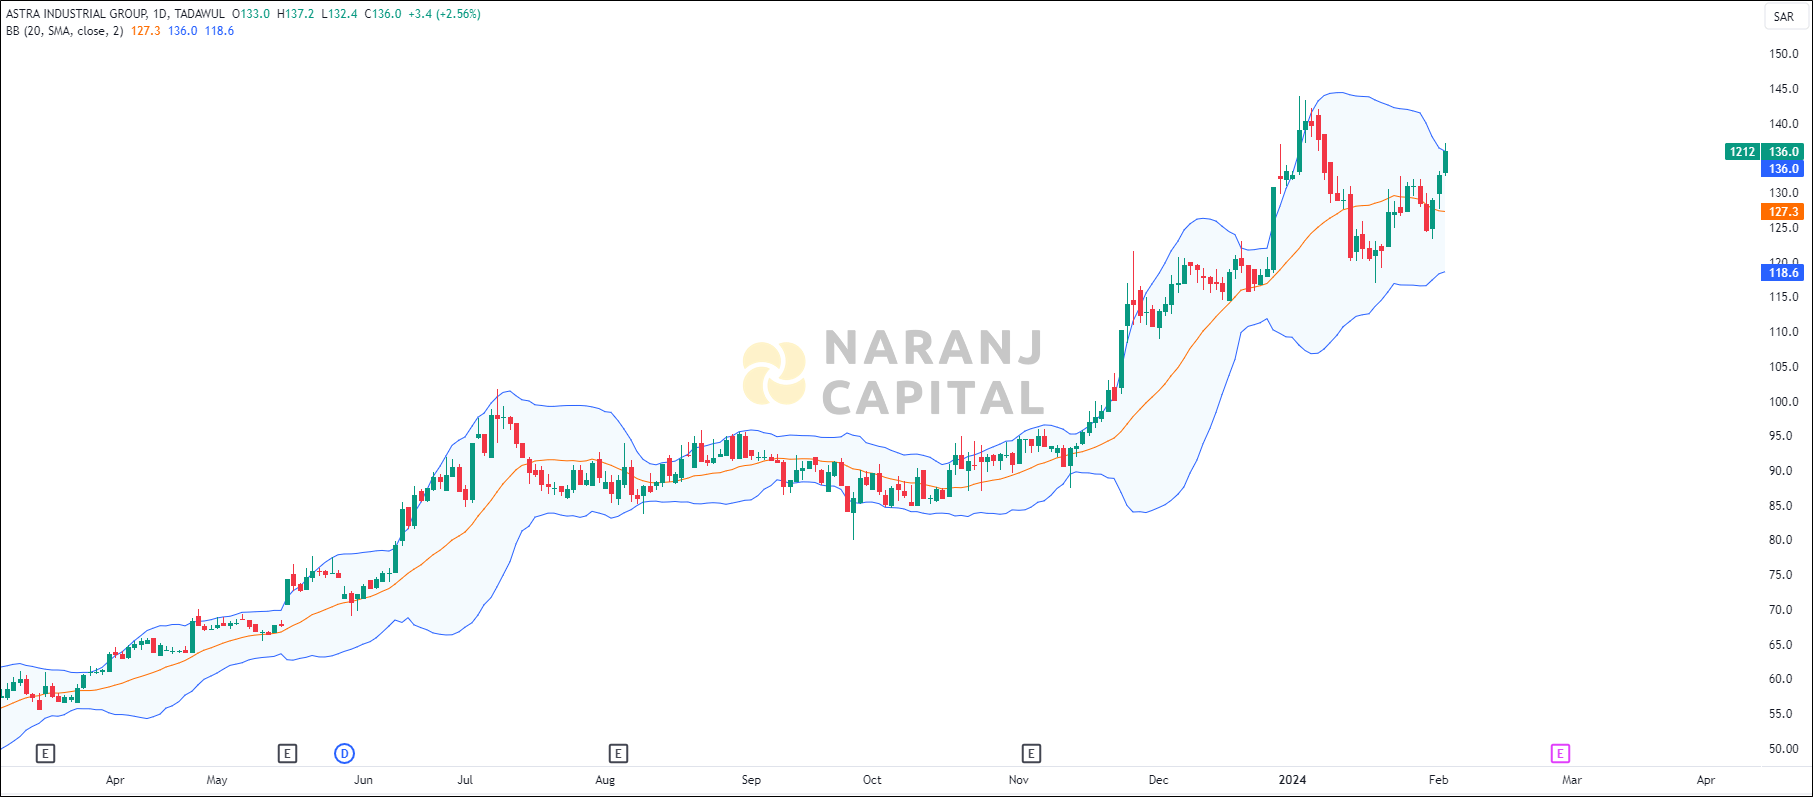
From Nov’23 to Jan’24, price was continuously hugging its upper band. After a short downfall, price took support at the lower band and bounced back. Currently the price is trying to exceed the upper band, which shows the bullish sentiment.
Based on our Saudi stock recommendations, Astra Industrial Group stock price target will be SAR 144 - SAR 148 in the next 14-15 trading sessions.