Mobily: A Smart Investment in Saudi Arabia’s Thriving Telecom Industry

Analysed By
Stock Market

-

  • Buy
  • Buy
    Range
  • Target
  • Stoploss
  • Duration
  • Upside
    Potential
  • Etihad Etisalat
  • 55 - 55.5
  • 70 - 75
  • 50
  • 12-15 months
  • 30% - 35%
  • Buy Etihad Etisalat
  • Buy
    Range
    55 - 55.5
  • Target 70 - 75
  • Stoploss 50
  • Duration 12-15 months
  • Upside
    Potential
    30% - 35%
  • Stock Overview

  • Tadawul
  • Name
  • Sector
  • 52 Weeks
    High
  • 52 Weeks
    Low
  • 7020
  • ETIHAD ETISALAT
  • Telecommunication
  • 59.5
  • 48.75
  • Tadawul 7020
  • Name ETIHAD ETISALAT
  • Sector Telecommunication
  • 52 Weeks
    High
    59.5
  • 52 Weeks
    Low
    48.75
    • Market Capitalization - ‪‪42.2 B‬ SAR
    • Relative Strength

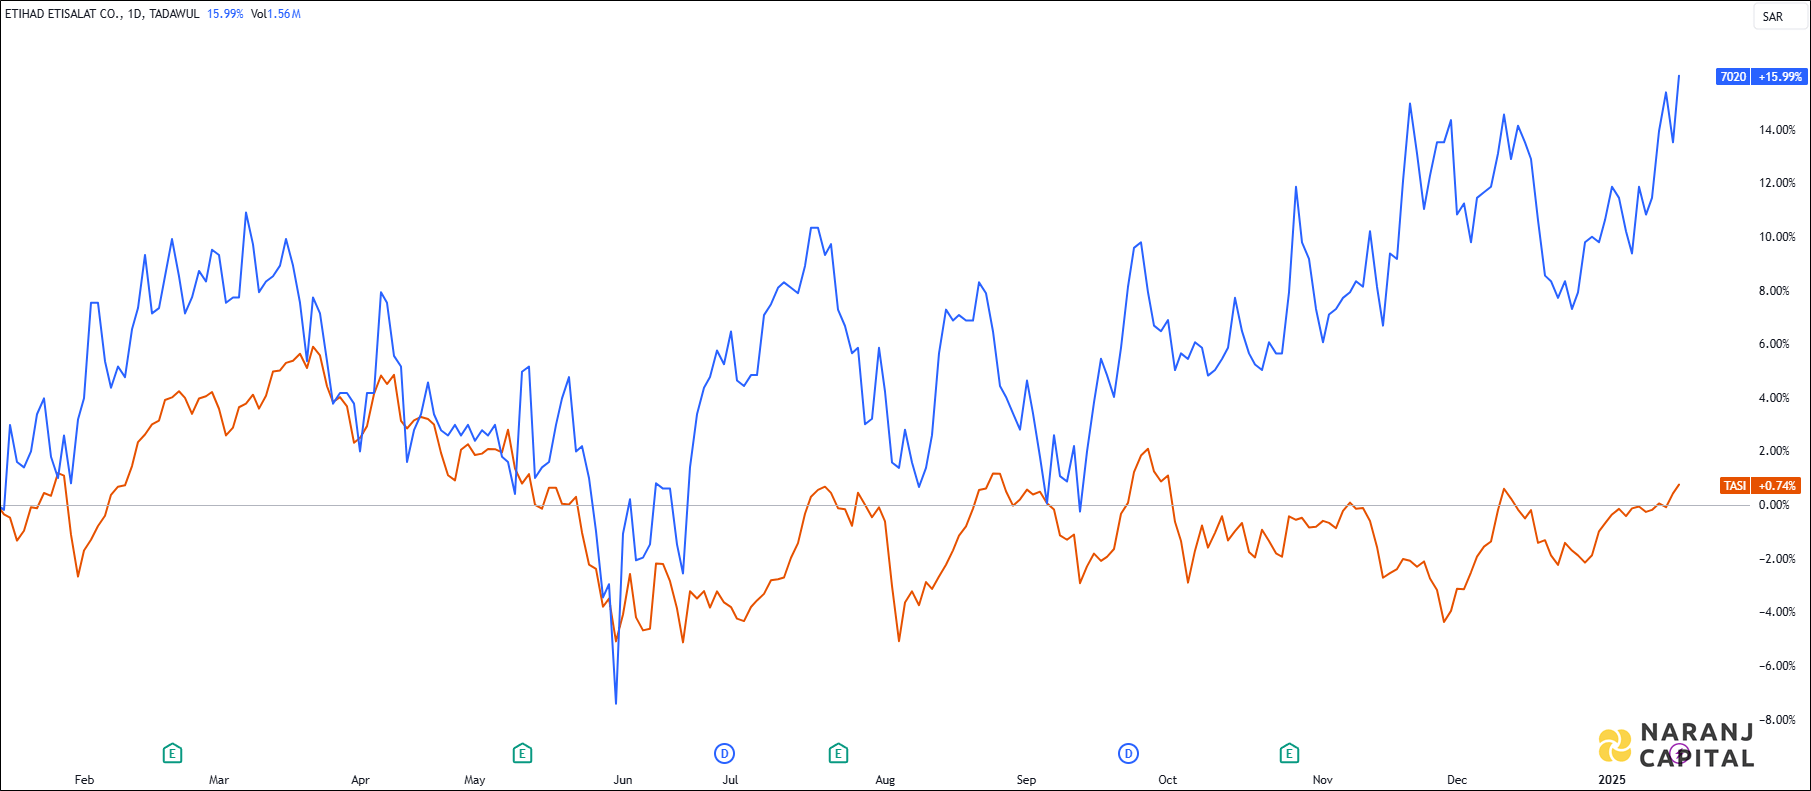
    Relative Strength - Tadawul 7020 vs TASI

    The chart highlights Etihad Etisalat's strong performance, with a 15% annual return that outshines the Tadawul all-share index.

  • Technical Analysis

    Etihad Estate Weekly Chart

    • The chart indicates a clear uptrend in the stock price.
    • Notably, over the past year, the stock has experienced a prolonged consolidation phase, forming a distinct Ascending Triangle pattern.
    • A breakout from this pattern is anticipated, likely driving the price higher and extending its upward trajectory.
  • Revenue & Profit Analysis

    • Year-on-year
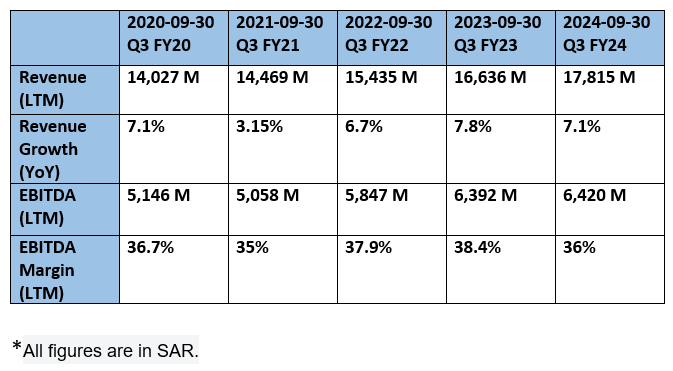
      • In Q3 FY24, sales totaled 17,815 million SAR (LTM), marking a 7% increase from 16,636 million SAR (LTM) in the same period last year.
      • EBITDA for Q3 FY24 rose to 6,420 million SAR (LTM), a slight increase from 6,392 million SAR (LTM) in Q3 FY23.
      • The EBITDA margin experienced a minor decline, recorded at 36% (LTM) in Q3 FY24, down from 38.4% in Q3 FY23 (LTM).
    • Quarter-on-quarter
      • On a quarterly basis, sales for Q3 amounted to 4,498 million SAR, a rise from 4,465 million SAR in Q2.
      • EBITDA for Q3 saw a substantial increase, reaching 2,148 million SAR, compared to 1,348 million SAR in Q2.
      • The diluted EPS for Q3 was reported at 3.73 SAR (LTM), an increase from 3.34 SAR (LTM) in Q2 2024.
  • Valuation

    • P/E Ratio
      • This stock presents an appealing valuation, with a Price-To-Earnings Ratio of 15.x, slightly higher than the peer average of 13.8x.
    • P/B Ratio
      • The stock's Price-To-Book ratio is 2.4x, indicating it may be overvalued compared to the peer average of 1.5x. However, a P/B ratio below 3x is typically considered a reasonable valuation.
    • PEG Ratio
      • The PEG ratio of 0.40 indicates that the stock is undervalued in relation to its anticipated earnings growth.
    • Cash Flow Analysis
      • As per Q3 FY24, cash flow from operations declined slightly by 6% to 5,600 million SAR (LTM), down from 5,946 million SAR (LTM) in Q3 FY23.
  • Debt Analysis

    • As of Q3 FY24, Etisalat’s total debt stands at 6,310 million SAR, leading to a debt-to-equity ratio of 0.35. This marks a significant improvement, as the ratio has decreased from 0.89 over the last five years.
  • Top Shareholders

    • Blackrock has a significant ownership stake of 2.71% in this company, while The Vanguard Group holds a 1.33% interest.
  • Conclusion

    Saudi Arabia's telecommunications sector is poised for significant growth in the coming years, driven by the government's Vision 2030 initiative. This ambitious plan includes substantial investments in telecommunications infrastructure, particularly in building a national fiber optic network and expanding 5G services.

    As a leading telecommunications provider, Etihad Etisalat (Mobily) is strategically positioned to capitalize on this momentum., supported by its strong financial performance and positive technical aspects.


  • MONEY MANAGEMENT AND TRADING RULES

    ●   Buy within the recommended price range.

    ●   No need to rush. The recommendation remains valid for up to 7 days, not just at the market open.

    ●   Always respect the stop-loss. It defines your risk on the trade.

    ●   Once the trade moves in your favour, use a trailing stop-loss to protect and lock in profits.

    ●   Spread your trading capital across our other recommended stocks instead of putting it all into one trade.

    ●   Invest responsibly. Your ideal position size should be based on the downside risk of this trade, not the potential upside. Before entering, assess how much loss you can comfortably and financially absorb if it goes against you, and set your position size accordingly. Hedge positions where appropriate.

    ANALYST SUMMARY

    This research is prepared by the Naranj Capital research team under the guidance of Arijit Banerjee, CMT, CFTe, Founder and Director of Naranj Capital. Stock selection and all trade levels, including the buy range, targets and stop-loss, are personally finalised by him.

    Arijit is a veteran trader and active investor with over 16 years of experience across global markets. He has in-depth expertise in financial market research, advanced technical analysis, market cycles, algorithmic trading and portfolio management. He is a Chartered Market Technician (CMT), accredited by the CMT Association, USA, the leading global authority on technical analysis. He also holds the Certified Financial Technician (CFTe) designation from the International Federation of Technical Analysts (IFTA).

    The views expressed herein are based on publicly available information, internal research and other sources believed to be reliable, but not necessarily all-inclusive and not guaranteed as to accuracy. The recommendations provided herein are solely for informational purposes and are not intended to be and must not be taken alone as the basis for an investment/trading decision. Trading and investing are subject to market risk and the securities discussed and opinions expressed herein may not be suitable for all investors. Past performance is not indicative of future results. To read the full disclosure, please click here.

    Share with
    0 0 votes
    Article Rating
    Subscribe
    Notify of
    guest
    0 Comments

    Join Our Telegram Channel for Saudi Stock Market Update

    Join Naranj Capital on Telegram for free stock alerts

    Saudi Stock Analysis

    Join Our Telegram Channel for USA Stock Analysis Update

    Join Naranj Capital on Telegram for free stock alerts