- Naranj Research Desk

- 🇸🇦 Saudi Stock Market
- 🇺🇸 USA Stock Market


5% – 6%
12 - 14 Days
5% – 6%
12 - 14 Days
| Metric | Q3 2025 | Q2 2025 | QoQ % | Q3 2024 | YoY % |
|---|---|---|---|---|---|
| Net Revenues | $15,180M | $14,583M | 4.10% | $12,699M | 19.50% |
| Net Interest Income | $3,851M | $3,103M | 24.10% | $2,347M | 64.00% |
| Net Earnings | $4,098M | $3,723M | 10.10% | $2,990M | 37.10% |
| Diluted EPS | $12.25 | $10.91 | 12.30% | $8.40 | 45.80% |
| Return on Equity | 14.20% | 12.80% | +1.4% | 10.40% | +3.8% |
| Total AUS | $3,452B | $3,293B | 4.80% | $3,103B | 11.20% |
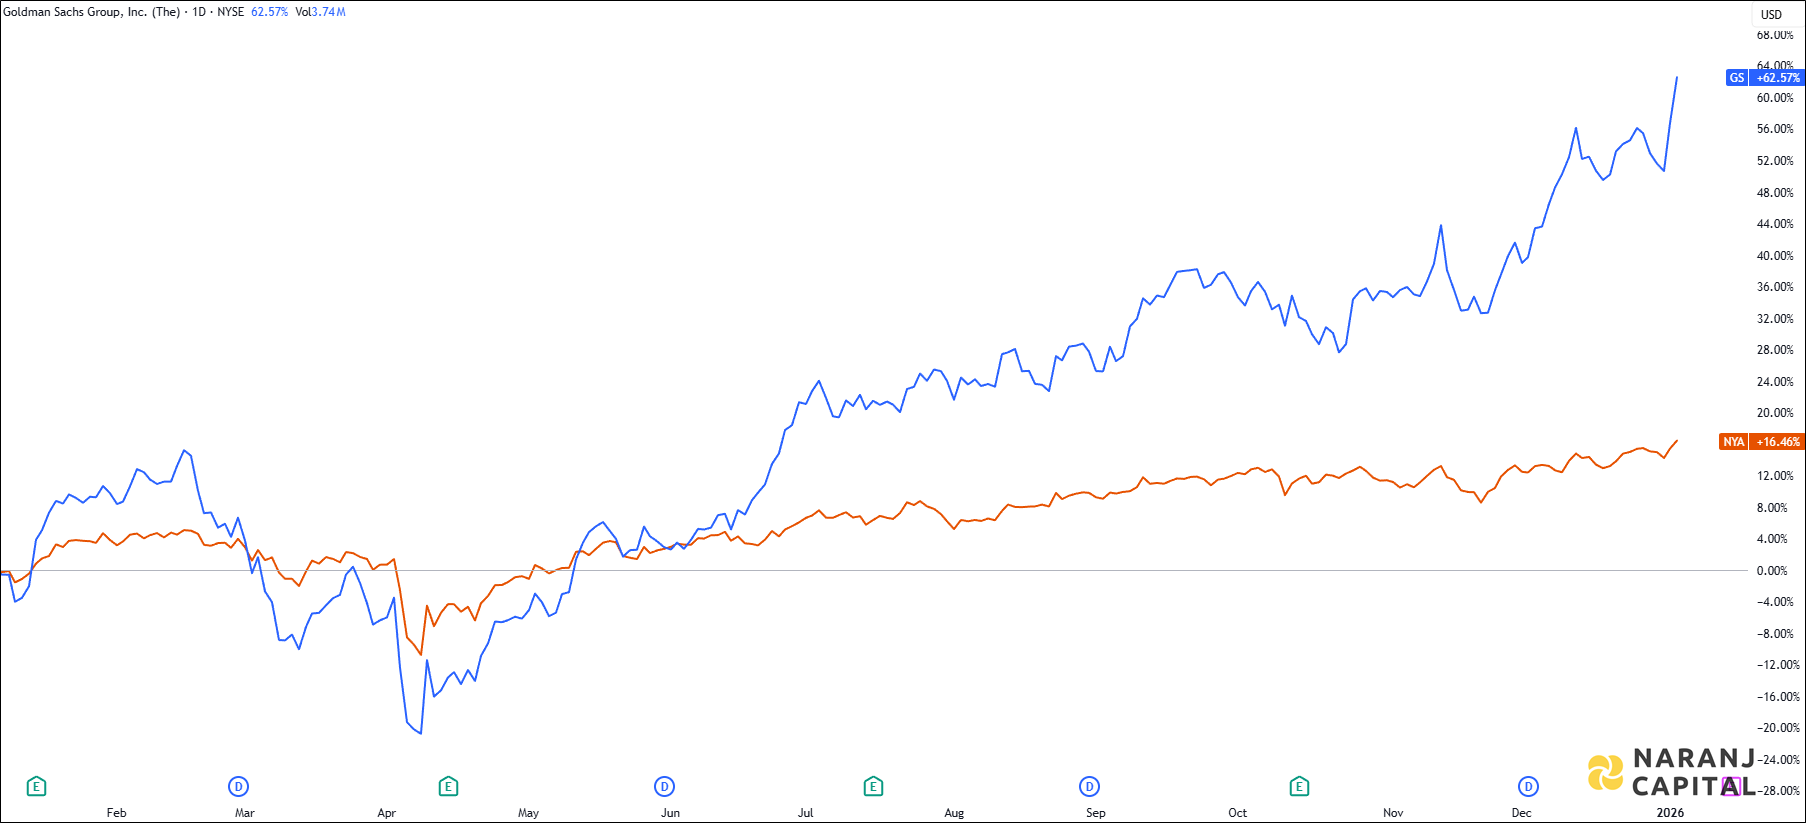
GS — NYSE —


| Indicator | Value | Zone |
|---|---|---|
| RSI-14 | 72.63 | Overbought |
| CCI-14 | 244.25 | Overbought |
| ROC | 7.41 | Positive |
| Stochastic RSI | 100.00 | Overbought |
| William %R | -6.61 | Overbought |
| EMA | Value | Stock Position |
|---|---|---|
| 5 EMA | 915.23 | Above |
| 10 EMA | 904.77 | Above |
| 20 EMA | 885.5 | Above |
| 50 EMA | 847.77 | Above |
| 100 EMA | 798.61 | Above |
| 200 EMA | 735.99 | Above |
Based on our swing short term trading in USA stocks, Goldman Sachs Group stock price target will be USD 1010 - USD 1020 in the next 12-14 trading sessions.





5% – 6%
12 - 14 Days
5% – 6%
12 - 14 Days
| Metric | Q3 2025 | Q2 2025 | QoQ % | Q3 2024 | YoY % |
|---|---|---|---|---|---|
| Net Revenues | $15,180M | $14,583M | 4.10% | $12,699M | 19.50% |
| Net Interest Income | $3,851M | $3,103M | 24.10% | $2,347M | 64.00% |
| Net Earnings | $4,098M | $3,723M | 10.10% | $2,990M | 37.10% |
| Diluted EPS | $12.25 | $10.91 | 12.30% | $8.40 | 45.80% |
| Return on Equity | 14.20% | 12.80% | +1.4% | 10.40% | +3.8% |
| Total AUS | $3,452B | $3,293B | 4.80% | $3,103B | 11.20% |
GS — NYSE —
| Indicator | Value | Zone |
|---|---|---|
| RSI-14 | 72.63 | Overbought |
| CCI-14 | 244.25 | Overbought |
| ROC | 7.41 | Positive |
| Stochastic RSI | 100.00 | Overbought |
| William %R | -6.61 | Overbought |
| EMA | Value | Stock Position |
|---|---|---|
| 5 EMA | 915.23 | Above |
| 10 EMA | 904.77 | Above |
| 20 EMA | 885.5 | Above |
| 50 EMA | 847.77 | Above |
| 100 EMA | 798.61 | Above |
| 200 EMA | 735.99 | Above |
Based on our swing short term trading in USA stocks, Goldman Sachs Group stock price target will be USD 1010 - USD 1020 in the next 12-14 trading sessions.