NYSE trade advice (A): US financial services stock | 4-6% gain | USA stock trading signal on 14 Jul 2026

Date
July 14, 2026
Analysed By
Naranj Capital Research Desk
Stock Market
NYSE, United States of America

Trading Signals in US Stocks

  • Buy
  • Buy
    Range
  • Target
  • Stoploss
  • Upside
    Potential
  • Trade
    Duration
  • Visa
  • 355 - 360
  • 375 - 380
  • Below 340
  • 4% - 6%
  • 12 - 14 Days
  • Locked Image
    Locked Image
    Locked Image
    Locked Image

    4% - 6%

    12 - 14 Days

  • Buy
    Visa
  • Buy
    Range
    355 - 360
  • Target
    375 - 380
  • Stoploss
    Below 340
  • Upside
    Potential
    4% - 6%
  • Trade
    Duration
    12 - 14 Days
  • Locked Image
    Locked Image
    Locked Image
    Locked Image

    4% - 6%

    12 - 14 Days

    * Once the first target hit, reset the StopLoss at your buying price.

    Visa (NYSE: V) - Stock Overview

  • NYSE Code
  • Stock Name
  • Sector
  • 52 Weeks High
  • 52 Weeks Low
  • V
  • Visa
  • Financial Services
  • 365.02
  • 293.89
  • NYSE Code V
  • Stock Name Visa
  • Sector Financial Services
  • 52 Weeks High 365.02
  • 52 Weeks Low 293.89
  • Visa (NYSE: V) - Q2 FY26 Financials Highlights

    Metric Q2 FY26 (Mar '26) Q1 FY26 (Dec '25) Q2 FY25 (Mar '25) QoQ Change YoY Change
    Net Revenue $11.23 B $10.90 B $9.59 B ▲ 3.0% ▲ 17.1%
    Operating Income (GAAP) $7.18 B $6.65 B $5.82 B ▲ 8.0% ▲ 23.4%
    Operating Margin (GAAP) 63.90% 61.00% 60.70% ▲ 290 bps ▲ 320 bps
    Net Income (GAAP) $6.02 B $5.90 B $4.58 B ▲ 2.0% ▲ 31.4%
    Diluted EPS (GAAP) $3.14 $3.03 $2.32 ▲ 3.6% ▲ 35.3%
    Non-GAAP Diluted EPS $3.31 $3.17 $2.76 ▲ 4.4% ▲ 19.9%

  • Visa (NYSE: V) - Earnings Call Summary for Q2/2026

    • Strong quarter: Revenue rose 17% YoY to $11.2 billion, while EPS came in at $3.31, beating expectations.
    • Growth driver: Value-Added Services (VAS) grew 27% and now contribute 30% of total revenue. Visa Direct transactions increased 23%.
    • Future focus: The company is expanding into AI-powered fraud detection and stablecoin-based payments.
    • Returning cash: Visa repurchased a record $7.9 billion of shares and approved a new $20 billion buyback program.
    • Positive outlook: Management raised its full-year growth guidance, supported by strong payment volumes and global expansion.
  • Visa (NYSE: V) vs NYSE - Relative Strength Comparison

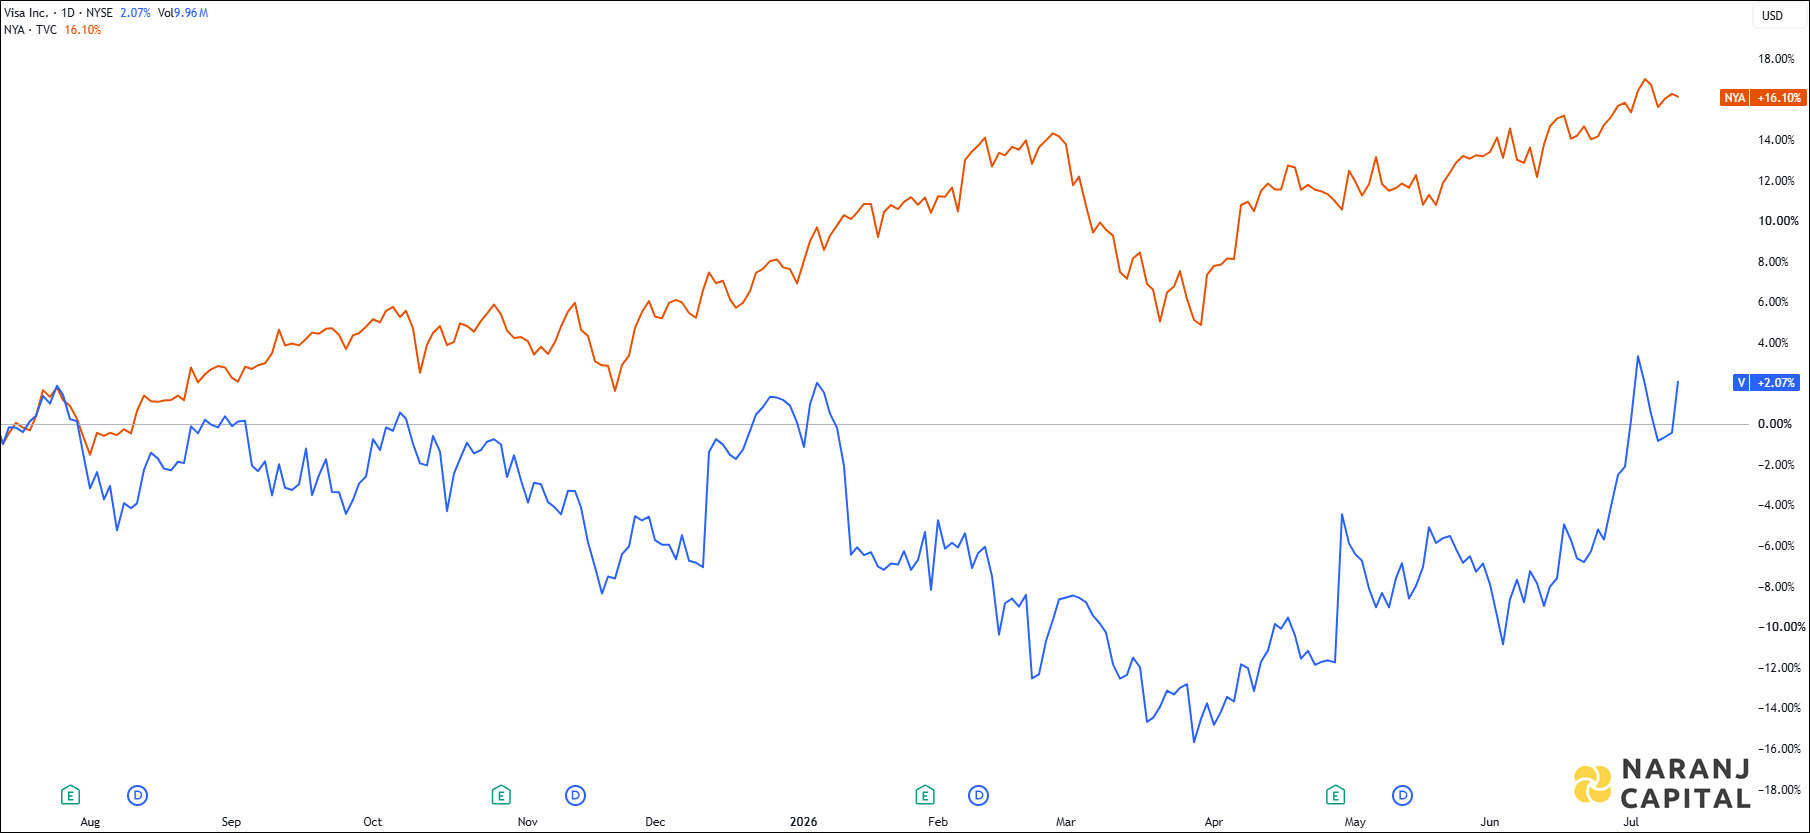
    The image showcases Visa's 1-year performance relative to NYSE.
    Relative Performance - Last 1 Year
    VISA —   NYSE —

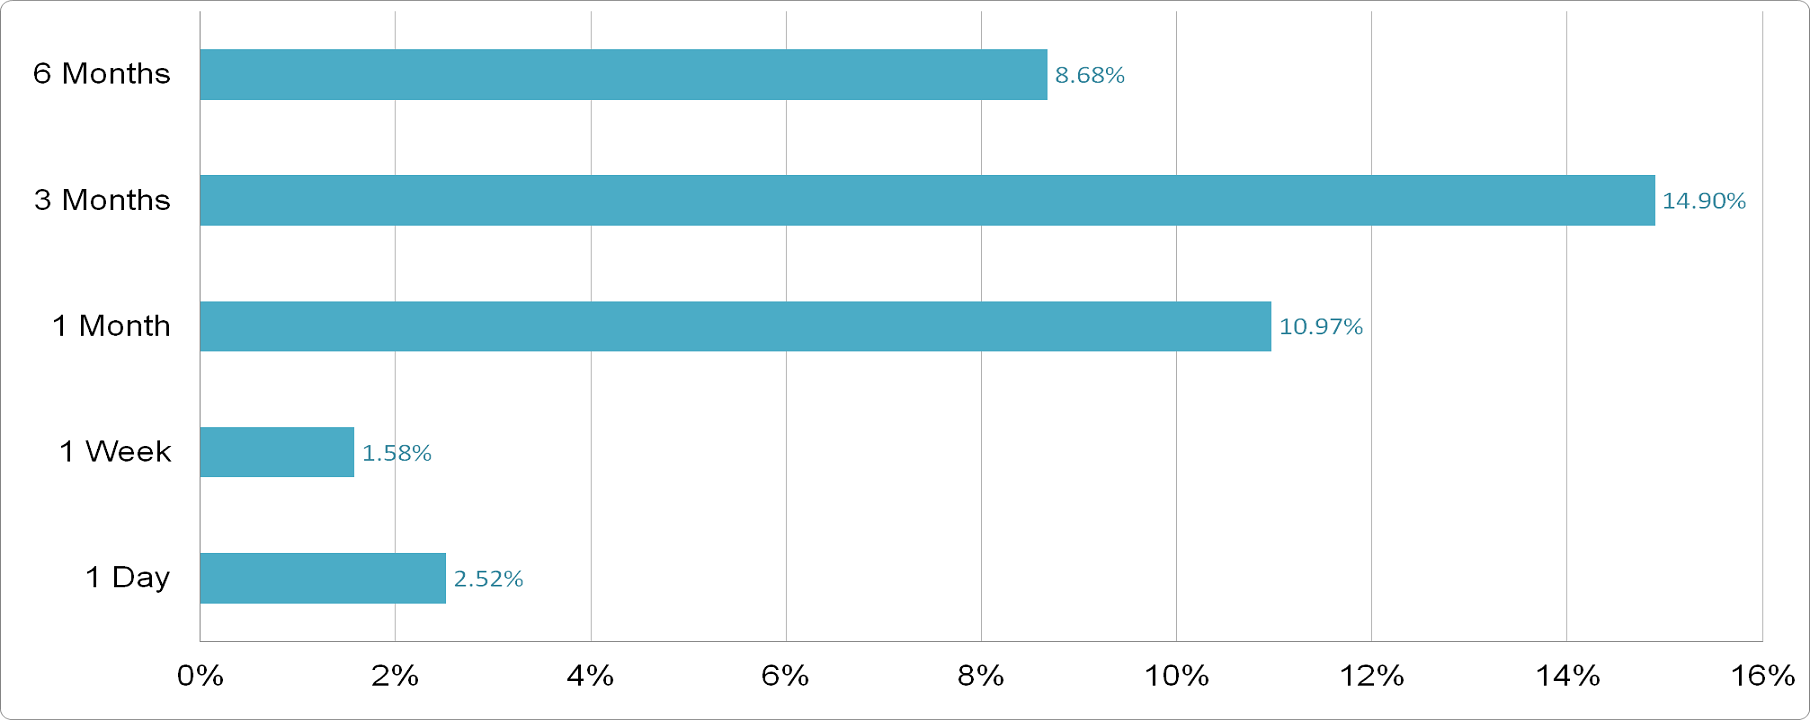
  • Visa (NYSE: V) - Price Performance

    Visa - Price Performance
    Visa - Price Performance

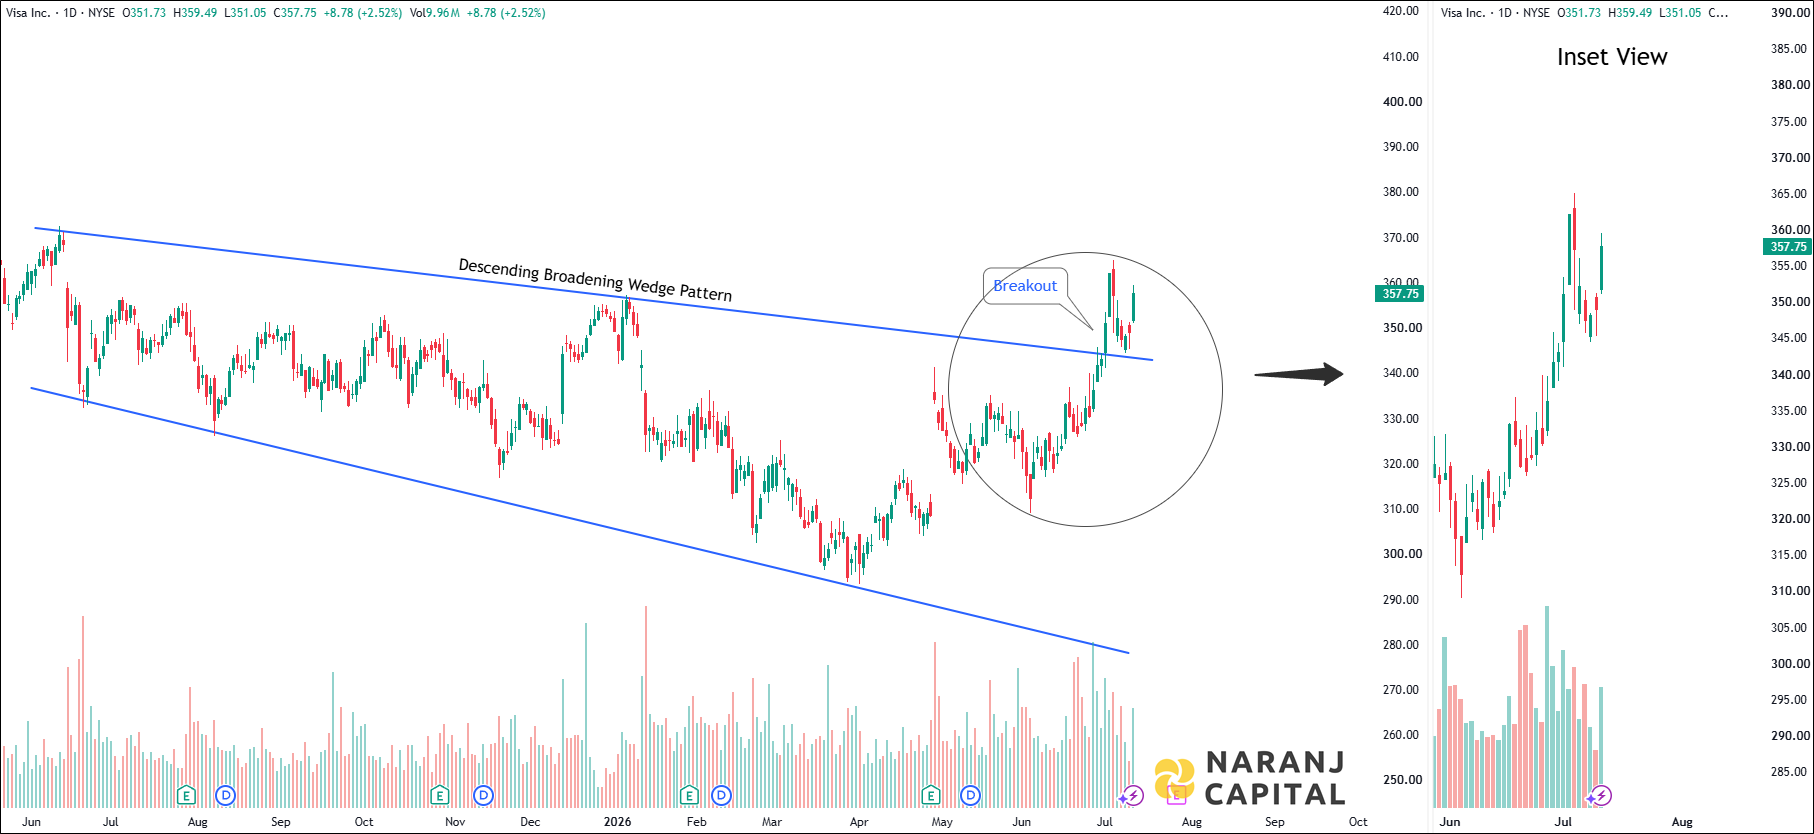
  • Visa (NYSE: V) - Technical Analysis (Daily)

    Visa - Daily Technical Analysis
    Visa - Daily Technical Analysis

    • Following the breakout from a Descending Broadening Wedge pattern, the stock successfully retested the breakout level and is now poised for a potential upside move.
  • Visa (NYSE: V) - Oscillators

    Indicator Value Zone
    RSI-14 66.69 Neutral
    CCI-14 105.46 Overbought
    ROC 9.54 Positive
    Stochastic RSI 54.21 Neutral
    William %R -19.20 Overbought

  • Visa (NYSE: V) - Exponential Moving Averages (EMAs)

    EMA Value Stock Position
    5 EMA 352.47 Above
    10 EMA 348.80 Above
    20 EMA 342.87 Above
    50 EMA 332.14 Above
    100 EMA 328.35 Above
    200 EMA 329.12 Above

  • Conclusion - Visa (NYSE: V) Stock Price Forecast

    Based on our trading advisory services for US stocks, Visa stock price target will be USD 45 - USD 45.5 in the next 12-14 trading sessions.

  • Share with
    0 0 votes
    Article Rating
    Subscribe
    Notify of
    guest
    0 Comments
    Join Our Telegram Channel for Saudi Stock Market Update
    Saudi Stock Analysis
    Join Our Telegram Channel for USA Stock Analysis Update
  • Buy
  • Buy
    Range
  • Target
  • Stoploss
  • Upside
    Potential
  • Trade
    Duration
  • Visa
  • 355 - 360
  • 375 - 380
  • Below 340
  • 4% - 6%
  • 12 - 14 Days
  • Buy Visa
  • Buy
    Range
    355 - 360
  • Target 375 - 380
  • Stoploss Below 340
  • Upside
    Potential
    4% - 6%
  • Trade
    Duration
    12 - 14 Days
  • Buy
  • Buy
    Range
  • Target
  • Stoploss
  • Upside
    Potential
  • Trade
    Duration
  • Visa
  • 355 - 360
  • 375 - 380
  • Below 340
  • 4% - 6%
  • 12 - 14 Days
  • Locked Image
    Locked Image
    Locked Image
    Locked Image

    4% - 6%

    12 - 14 Days

  • Buy
    Visa
  • Buy
    Range
    355 - 360
  • Target
    375 - 380
  • Stoploss
    Below 340
  • Upside
    Potential
    4% - 6%
  • Trade
    Duration
    12 - 14 Days
  • Locked Image
    Locked Image
    Locked Image
    Locked Image

    4% - 6%

    12 - 14 Days

    * Once the first target hit, reset the StopLoss at your buying price.
    * Trade durations are approximate; actual holding period may vary.

    Visa (NYSE: V) - Stock Overview

  • NYSE Code
  • Stock Name
  • Sector
  • 52 Weeks High
  • 52 Weeks Low
  • V
  • Visa
  • Financial Services
  • 365.02
  • 293.89
  • NYSE Code V
  • Stock Name Visa
  • Sector Financial Services
  • 52 Weeks High 365.02
  • 52 Weeks Low 293.89
  • Company profile

    Visa Inc. is one of the world’s largest digital payments companies, connecting consumers, merchants, banks, and governments through its global payment network, VisaNet. The company processes credit, debit, prepaid, and digital payments, while also offering services such as Tap to Pay, Visa Direct, fraud prevention, payment security, and business payment solutions. Visa does not lend money or issue cards itself—it earns revenue by processing transactions made on its network. Founded in 1958, the company is headquartered in San Francisco, California, USA.

  • Visa (NYSE: V) - Q2 FY26 Financials Highlights

    Metric Q2 FY26 (Mar '26) Q1 FY26 (Dec '25) Q2 FY25 (Mar '25) QoQ Change YoY Change
    Net Revenue $11.23 B $10.90 B $9.59 B ▲ 3.0% ▲ 17.1%
    Operating Income (GAAP) $7.18 B $6.65 B $5.82 B ▲ 8.0% ▲ 23.4%
    Operating Margin (GAAP) 63.90% 61.00% 60.70% ▲ 290 bps ▲ 320 bps
    Net Income (GAAP) $6.02 B $5.90 B $4.58 B ▲ 2.0% ▲ 31.4%
    Diluted EPS (GAAP) $3.14 $3.03 $2.32 ▲ 3.6% ▲ 35.3%
    Non-GAAP Diluted EPS $3.31 $3.17 $2.76 ▲ 4.4% ▲ 19.9%

  • Visa (NYSE: V) - Earnings Call Summary for Q2/2026

    • Strong quarter: Revenue rose 17% YoY to $11.2 billion, while EPS came in at $3.31, beating expectations.
    • Growth driver: Value-Added Services (VAS) grew 27% and now contribute 30% of total revenue. Visa Direct transactions increased 23%.
    • Future focus: The company is expanding into AI-powered fraud detection and stablecoin-based payments.
    • Returning cash: Visa repurchased a record $7.9 billion of shares and approved a new $20 billion buyback program.
    • Positive outlook: Management raised its full-year growth guidance, supported by strong payment volumes and global expansion.
  • Visa (NYSE: V) vs NYSE - Relative Strength Comparison

    The image showcases Visa's 1-year performance relative to NYSE.
    Relative Performance - Last 1 Year
    VISA —   NYSE —

  • Visa (NYSE: V) - Price Performance

    Visa - Price Performance
    Visa - Price Performance

  • Visa (NYSE: V) - Technical Analysis (Daily)

    Visa - Daily Technical Analysis
    Visa - Daily Technical Analysis

    • Following the breakout from a Descending Broadening Wedge pattern, the stock successfully retested the breakout level and is now poised for a potential upside move.
  • Visa (NYSE: V) - Oscillators

    Indicator Value Zone
    RSI-14 66.69 Neutral
    CCI-14 105.46 Overbought
    ROC 9.54 Positive
    Stochastic RSI 54.21 Neutral
    William %R -19.20 Overbought

  • Visa (NYSE: V) - Exponential Moving Averages (EMAs)

    EMA Value Stock Position
    5 EMA 352.47 Above
    10 EMA 348.80 Above
    20 EMA 342.87 Above
    50 EMA 332.14 Above
    100 EMA 328.35 Above
    200 EMA 329.12 Above

  • Conclusion - Visa (NYSE: V) Stock Price Forecast

    Based on our trading advisory services for US stocks, Visa stock price target will be USD 45 - USD 45.5 in the next 12-14 trading sessions.

  • Share with
    0 0 votes
    Article Rating
    Subscribe
    Notify of
    guest
    0 Comments

    Join Our Telegram Channel for USA Stock Market Update

    USA Stock Analysis

    Details of Arijit Banerjee

    Arijit Banerjee CMT CFTe is a seasoned expert in the financial industry, boasting decades of experience in trading, investment, and wealth management. As the founder and chief strategist of Naranj Capital, he’s built a reputation for providing insightful research analysis to guide investment decisions.

    Arijit’s credentials are impressive, holding both the Chartered Market Technician (CMT) and Certified Financial Technician (CFTe) designations. These certifications demonstrate his expertise in technical analysis and financial markets.

    Through Naranj Capital, Arijit shares his market insights and research analysis, offering actionable advice for investors. His work is featured on platforms like TradingView, where he publishes detailed analysis and recommendations.

    If you’re interested in learning more about Arijit’s work or Naranj Capital’s services, you can reach out to them directly through their website