- Naranj Research Desk
- 🇸🇦 Saudi Stock Market
- 🇺🇸 USA Stock Market


4% – 5%
12 - 14 Days
4% – 5%
12 - 14 Days
| KPI | Q1 FY26 | Q4 FY25 | QoQ Change | Q1 FY25 | YoY Change |
|---|---|---|---|---|---|
| Total Revenue | $1,670.00M | $1,169.44M | 42.80% | $1,217.00M | 37.10% |
| Adjusted EBITDA | $713.00M | $506.40M | 40.80% | $560.00M | 27.30% |
| EBITDA Margin | 42.70% | 43.30% | -60 bps | 46.0% | -330 bps |
| Operating Cash Flow | $507.50M | $404.99M | 25.30% | $420.00M | 20.80% |
| Oil & Gas Revenue | $1,670.00M | $1,169.44M | 42.80% | $1,217.00M | 37.10% |
CHRD — NASDAQ —
| Indicator | Value | Zone |
|---|---|---|
| RSI-14 | 65.97 | Neutral |
| CCI-14 | 130.92 | Overbought |
| ROC | 14.83 | Positive |
| Stochastic RSI | 99.46 | Overbought |
| William %R | -4.29 | Overbought |
| EMA | Value | Stock Position |
|---|---|---|
| 5 EMA | 146.28 | Above |
| 10 EMA | 142.84 | Above |
| 20 EMA | 139.34 | Above |
| 50 EMA | 130.13 | Above |
| 100 EMA | 120.29 | Above |
| 200 EMA | 112.74 | Above |
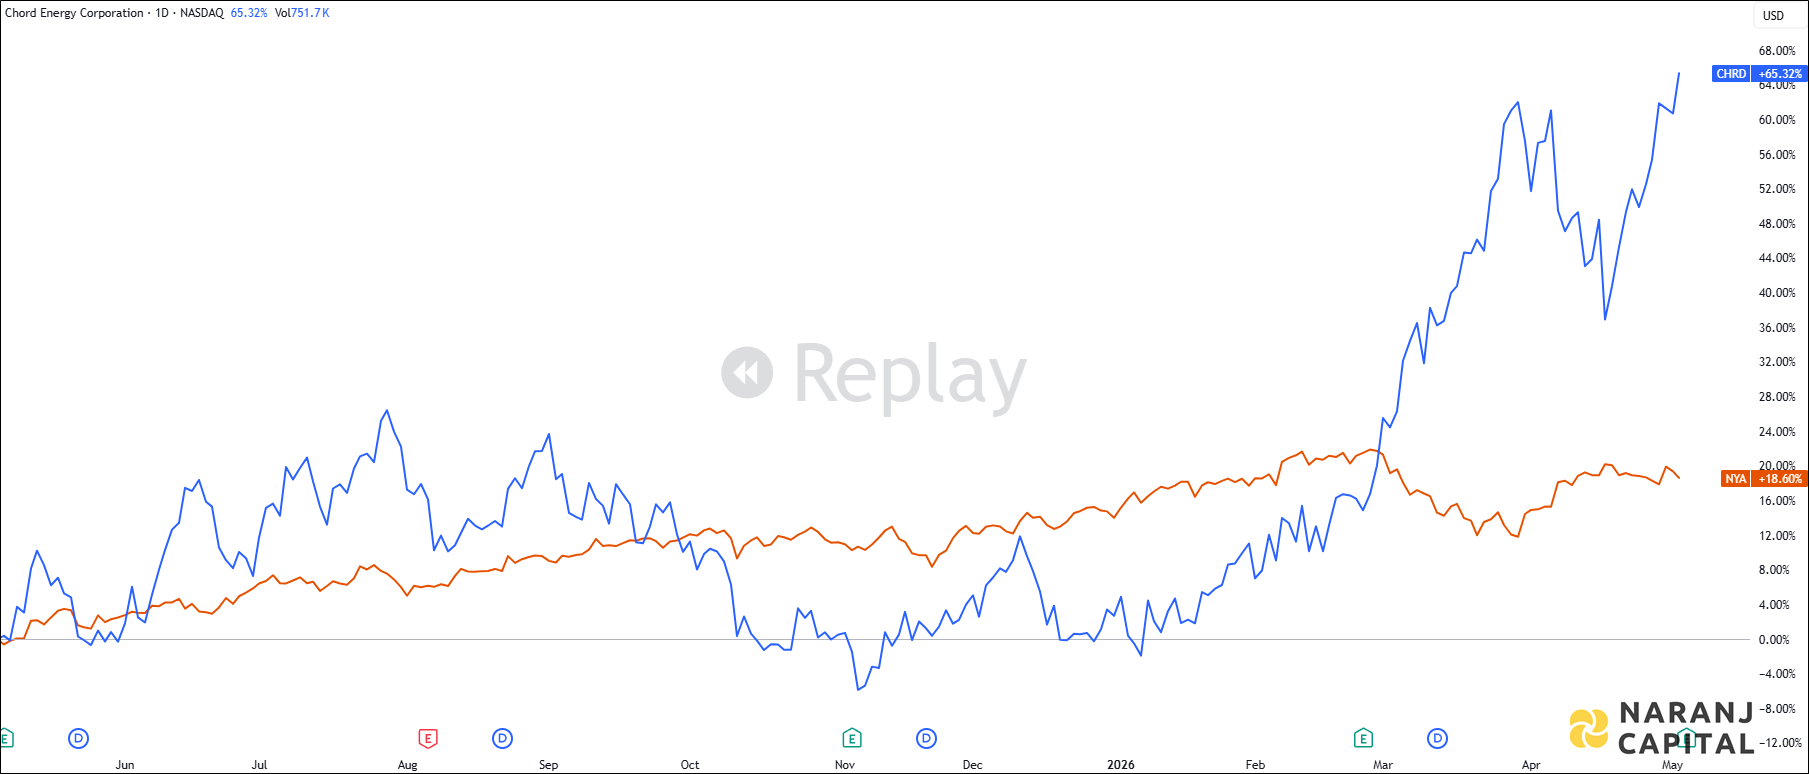
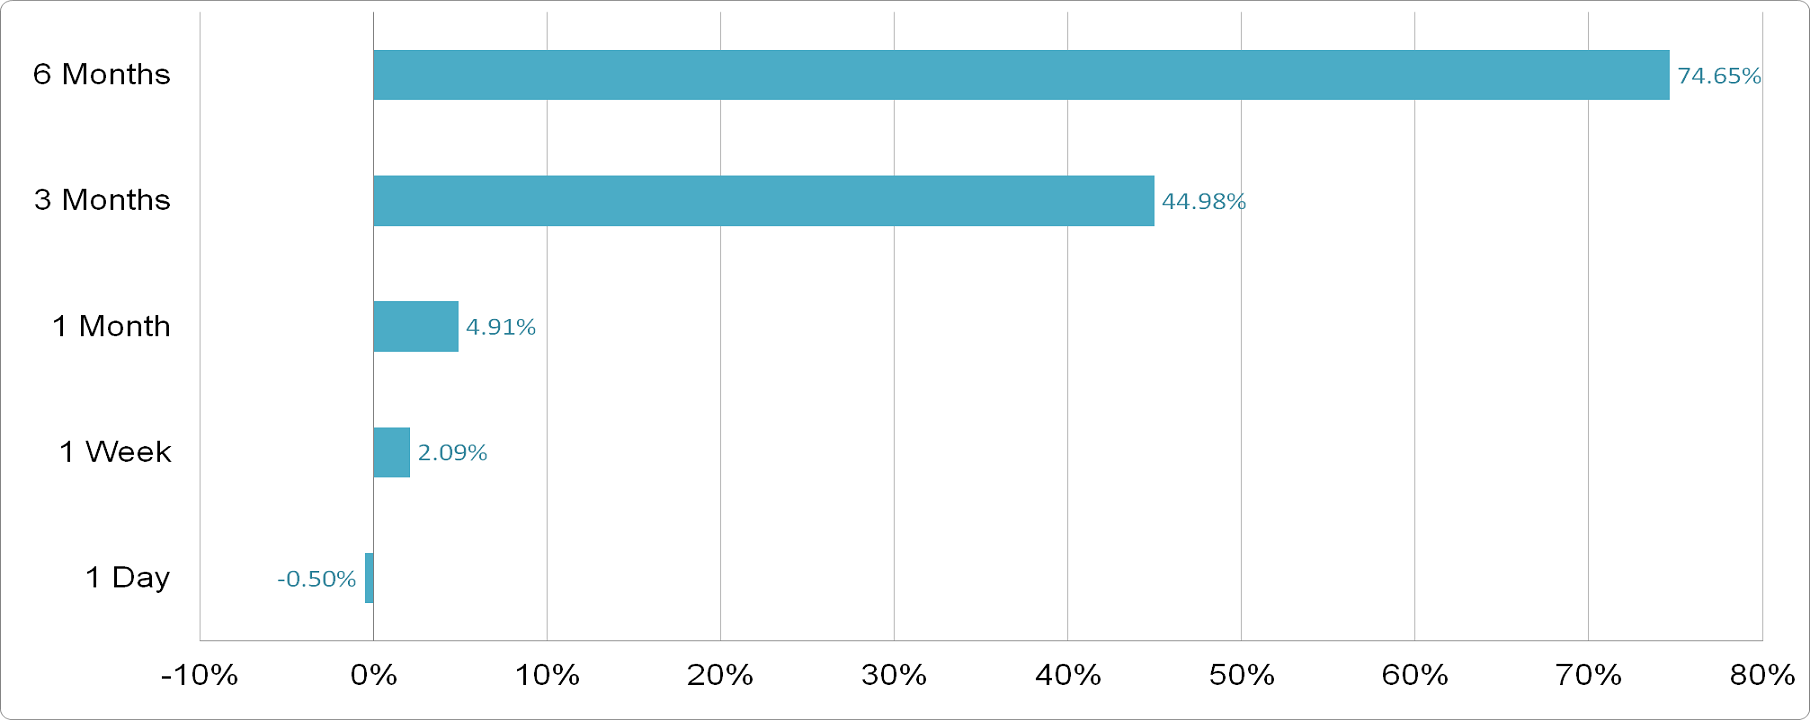
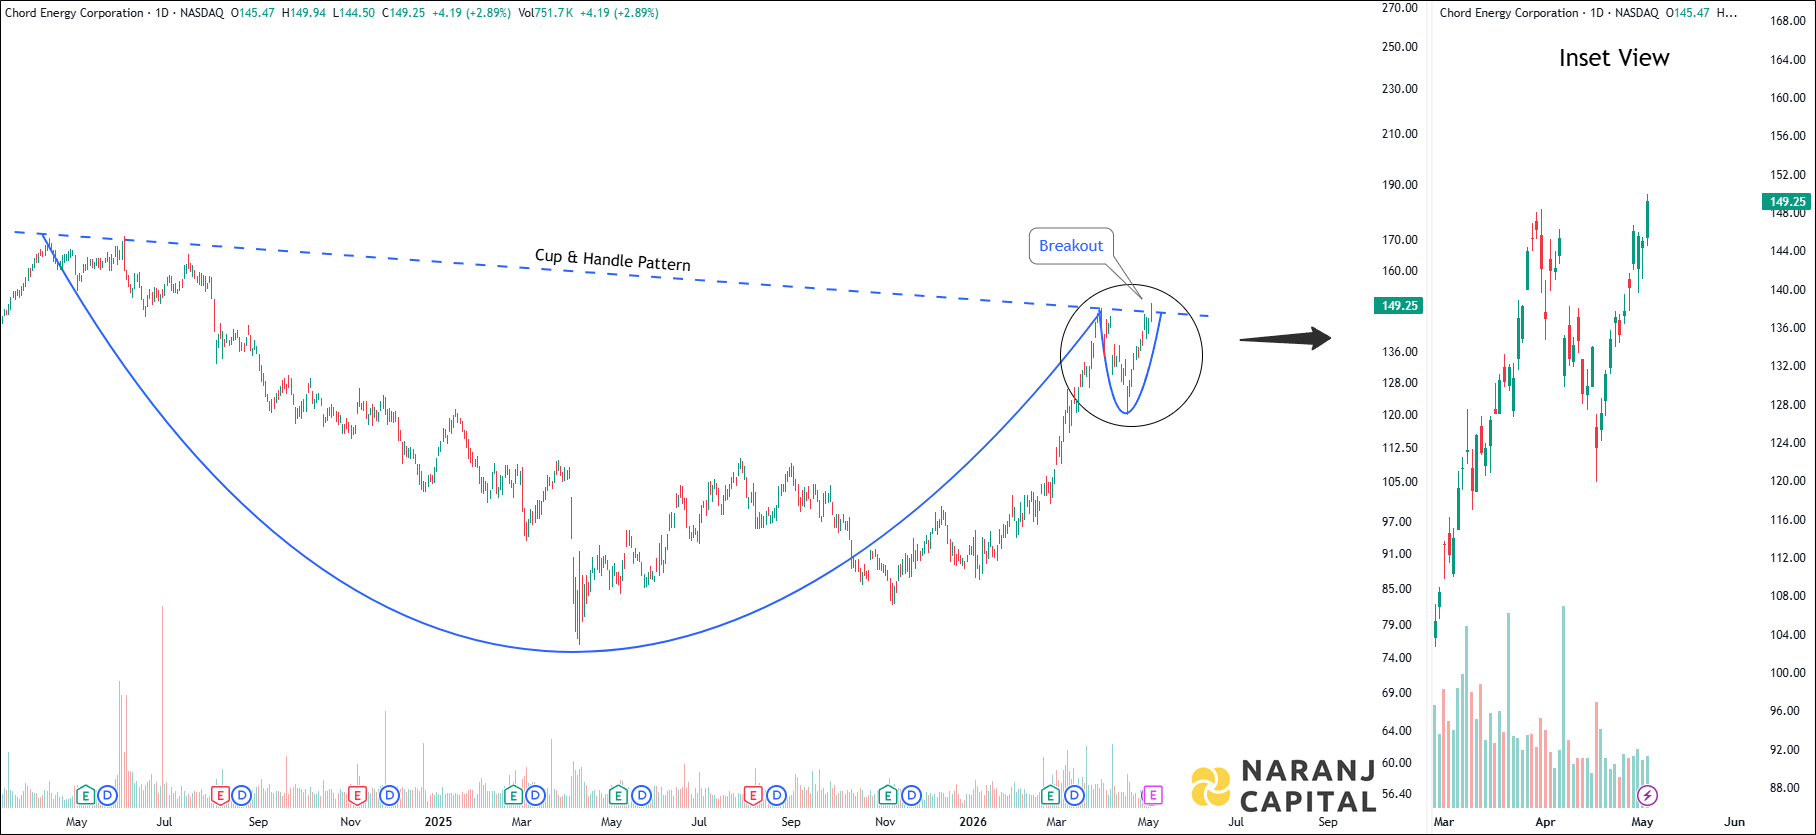
Based on our US stock recommendations, Cord Energy Corporation stock price target will be USD 156 - USD 158 in the next 12-14 trading sessions.


4% – 5%
12 - 14 Days
4% – 5%
12 - 14 Days
| KPI | Q1 FY26 | Q4 FY25 | QoQ Change | Q1 FY25 | YoY Change |
|---|---|---|---|---|---|
| Total Revenue | $1,670.00M | $1,169.44M | 42.80% | $1,217.00M | 37.10% |
| Adjusted EBITDA | $713.00M | $506.40M | 40.80% | $560.00M | 27.30% |
| EBITDA Margin | 42.70% | 43.30% | -60 bps | 46.0% | -330 bps |
| Operating Cash Flow | $507.50M | $404.99M | 25.30% | $420.00M | 20.80% |
| Oil & Gas Revenue | $1,670.00M | $1,169.44M | 42.80% | $1,217.00M | 37.10% |
CHRD — NASDAQ —
| Indicator | Value | Zone |
|---|---|---|
| RSI-14 | 65.97 | Neutral |
| CCI-14 | 130.92 | Overbought |
| ROC | 14.83 | Positive |
| Stochastic RSI | 99.46 | Overbought |
| William %R | -4.29 | Overbought |
| EMA | Value | Stock Position |
|---|---|---|
| 5 EMA | 146.28 | Above |
| 10 EMA | 142.84 | Above |
| 20 EMA | 139.34 | Above |
| 50 EMA | 130.13 | Above |
| 100 EMA | 120.29 | Above |
| 200 EMA | 112.74 | Above |
Based on our US stock recommendations, Cord Energy Corporation stock price target will be USD 156 - USD 158 in the next 12-14 trading sessions.