- Naranj Research Desk
- 🇸🇦 Saudi Stock Market
- 🇺🇸 USA Stock Market


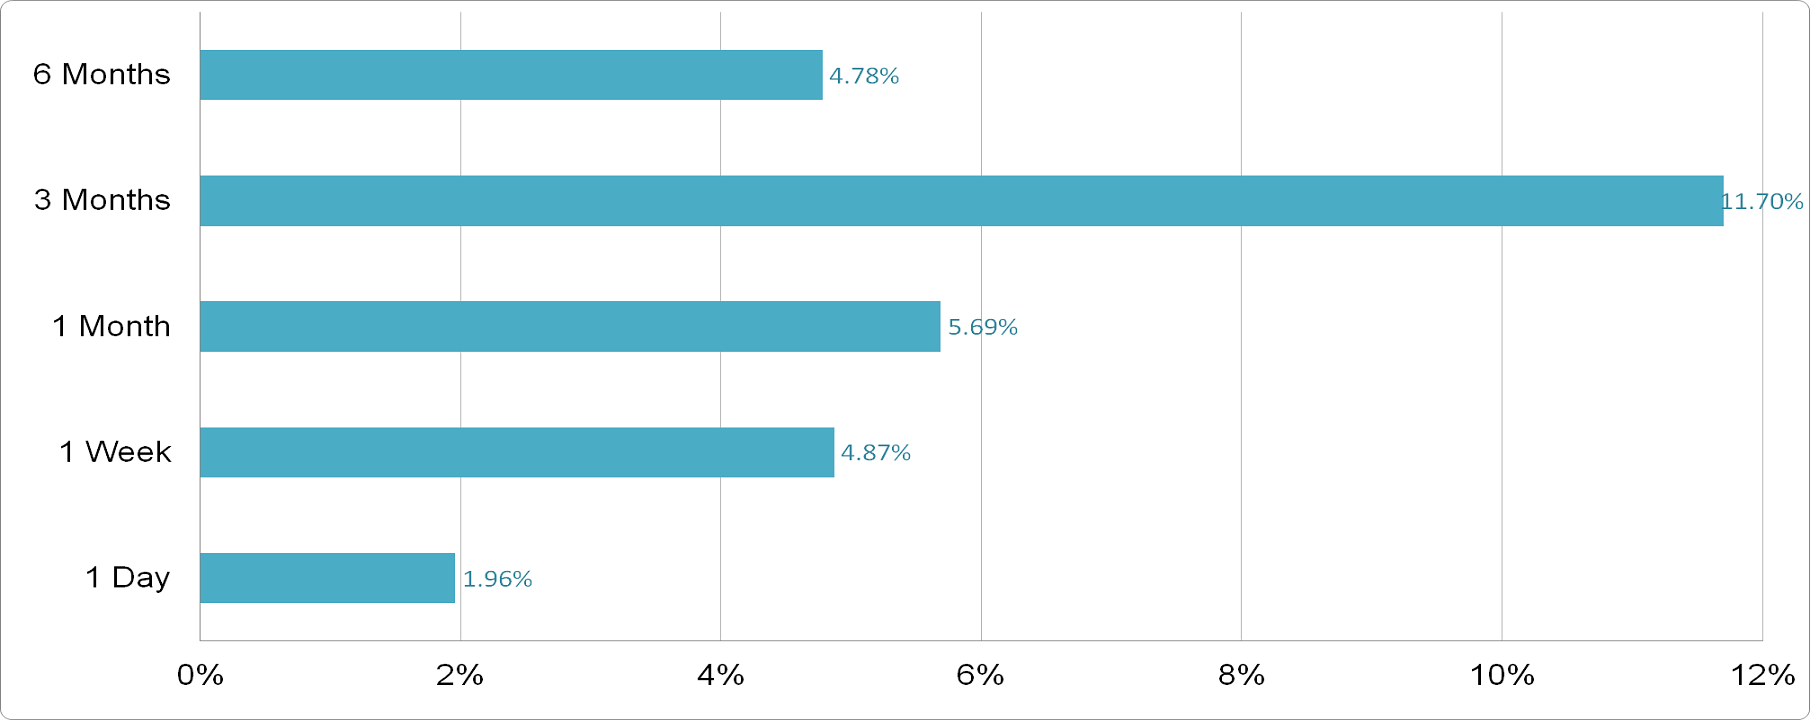
4% – 5%
12 - 14 Days
4% – 5%
12 - 14 Days
| Metrics | Q1 FY26 | Q4 FY25 | QoQ Change | Q1 FY25 | YoY Change |
|---|---|---|---|---|---|
| Revenue | $67,307M | $86,156M | -21.90% | $62,151M | 8.30% |
| EBITDA | $3,060M | $4,115M | -25.60% | $2,744M | 11.50% |
| Free Cash Flow | $3,162M | $1,901M | 66.30% | $1,996M | 58.40% |
| Gross Margin | 13.07% | 12.91% | +16 bps | 12.94% | +13 bps |
| Operating Margin | 3.66% | 3.88% | -22 bps | 3.53% | +13 bps |
| EBITDA Margin | 4.55% | 4.78% | -23 bps | 4.42% | +13 b |
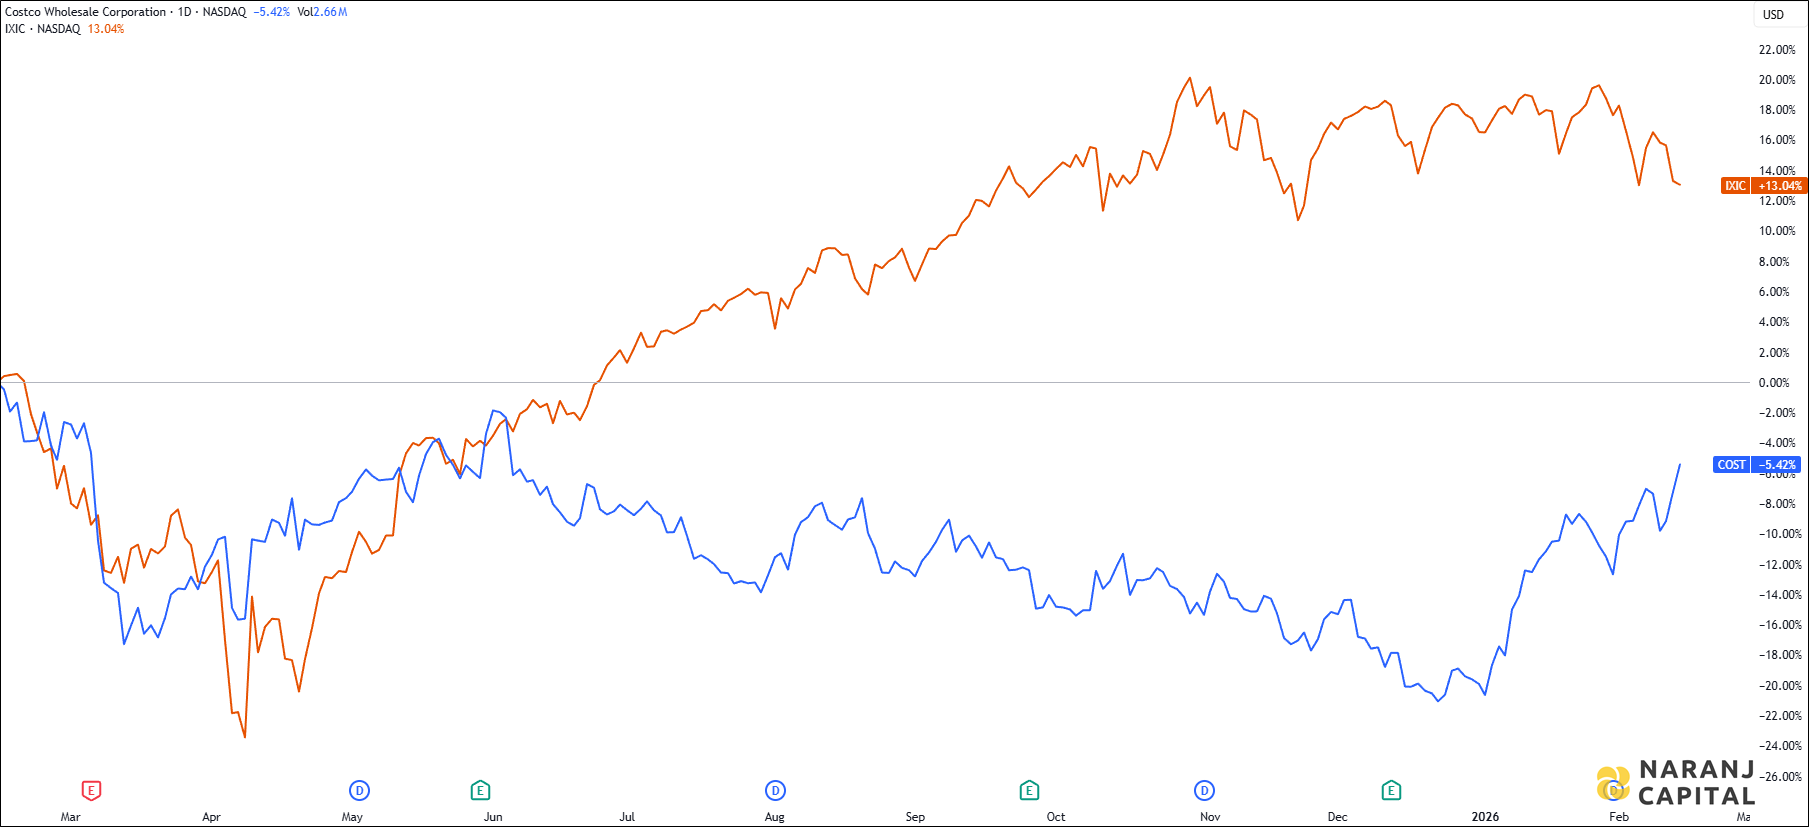
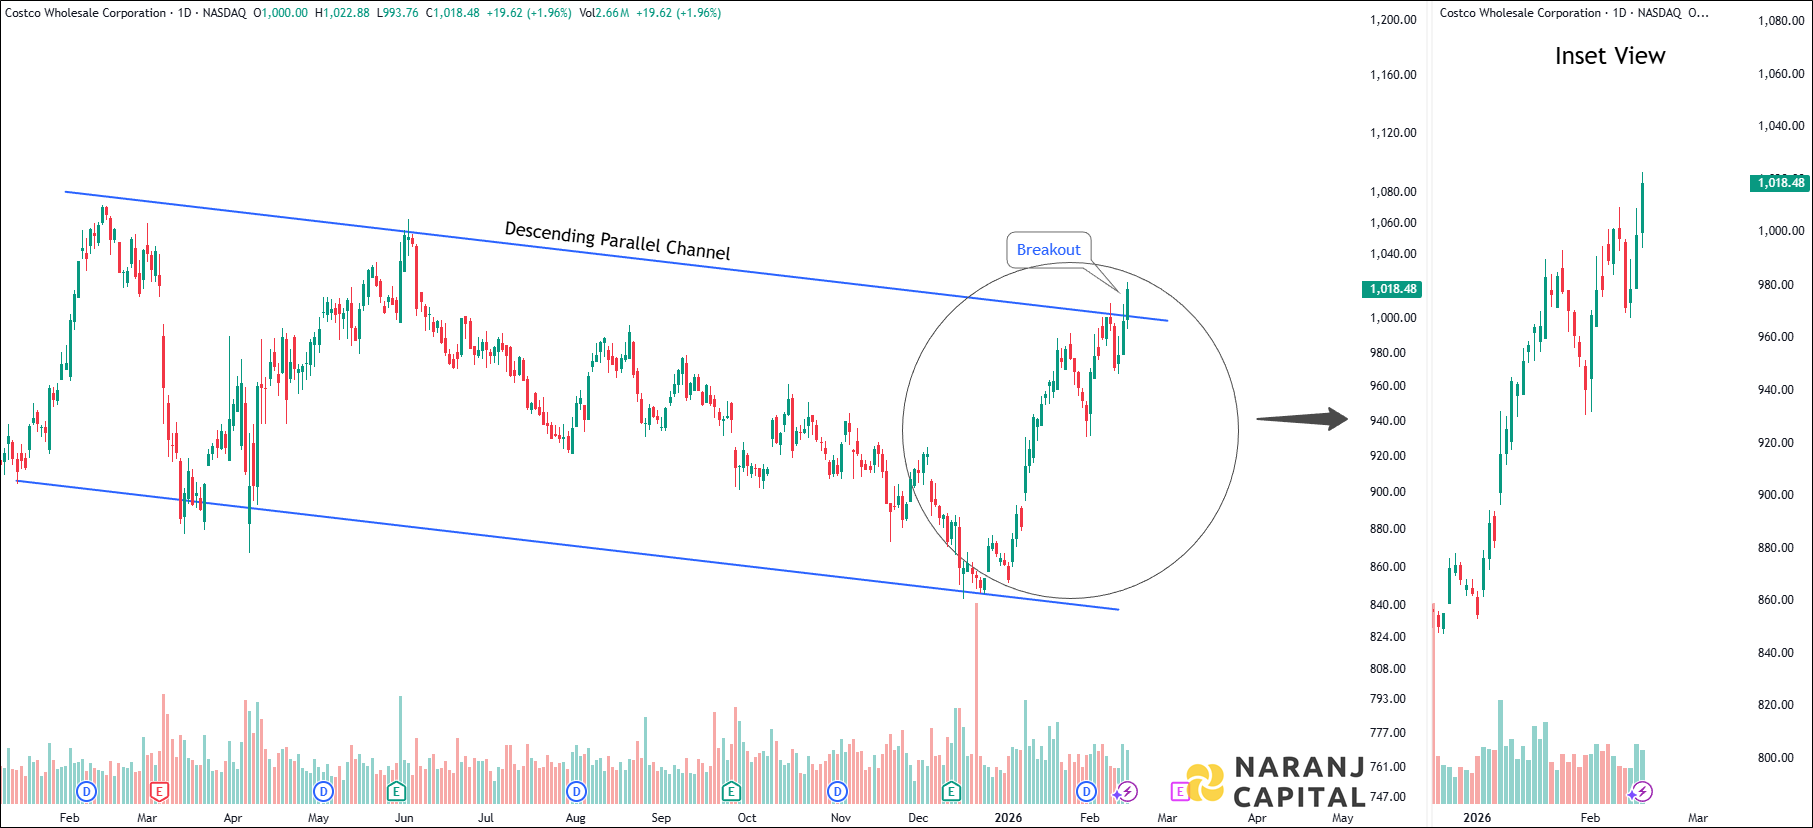
COST — NASDAQ —
| Indicator | Value | Zone |
|---|---|---|
| RSI-14 | 68.23 | Neutral |
| CCI-14 | 147.52 | Overbought |
| ROC | 4.18 | Positive |
| Stochastic RSI | 88.34 | Overbought |
| William %R | -4.6 | Overbought |
| EMA | Value | Stock Position |
|---|---|---|
| 5 EMA | 997.65 | Above |
| 10 EMA | 989.89 | Above |
| 20 EMA | 970.53 | Above |
| 50 EMA | 944.44 | Above |
| 100 EMA | 937.89 | Above |
| 200 EMA | 937.57 | Above |
Based on our short term trading plan in US stocks, Costco Wholesale Corporation stock price target will be USD 1060 - USD 1070 in the next 12-14 trading sessions.


4% – 5%
12 - 14 Days
4% – 5%
12 - 14 Days
| Metrics | Q1 FY26 | Q4 FY25 | QoQ Change | Q1 FY25 | YoY Change |
|---|---|---|---|---|---|
| Revenue | $67,307M | $86,156M | -21.90% | $62,151M | 8.30% |
| EBITDA | $3,060M | $4,115M | -25.60% | $2,744M | 11.50% |
| Free Cash Flow | $3,162M | $1,901M | 66.30% | $1,996M | 58.40% |
| Gross Margin | 13.07% | 12.91% | +16 bps | 12.94% | +13 bps |
| Operating Margin | 3.66% | 3.88% | -22 bps | 3.53% | +13 bps |
| EBITDA Margin | 4.55% | 4.78% | -23 bps | 4.42% | +13 b |
COST — NASDAQ —
| Indicator | Value | Zone |
|---|---|---|
| RSI-14 | 68.23 | Neutral |
| CCI-14 | 147.52 | Overbought |
| ROC | 4.18 | Positive |
| Stochastic RSI | 88.34 | Overbought |
| William %R | -4.6 | Overbought |
| EMA | Value | Stock Position |
|---|---|---|
| 5 EMA | 997.65 | Above |
| 10 EMA | 989.89 | Above |
| 20 EMA | 970.53 | Above |
| 50 EMA | 944.44 | Above |
| 100 EMA | 937.89 | Above |
| 200 EMA | 937.57 | Above |
Based on our short term trading plan in US stocks, Costco Wholesale Corporation stock price target will be USD 1060 - USD 1070 in the next 12-14 trading sessions.