- Naranj Research Desk
Last week, investors were hoping for another move towards 7,600. Instead, the market delivered a shock.
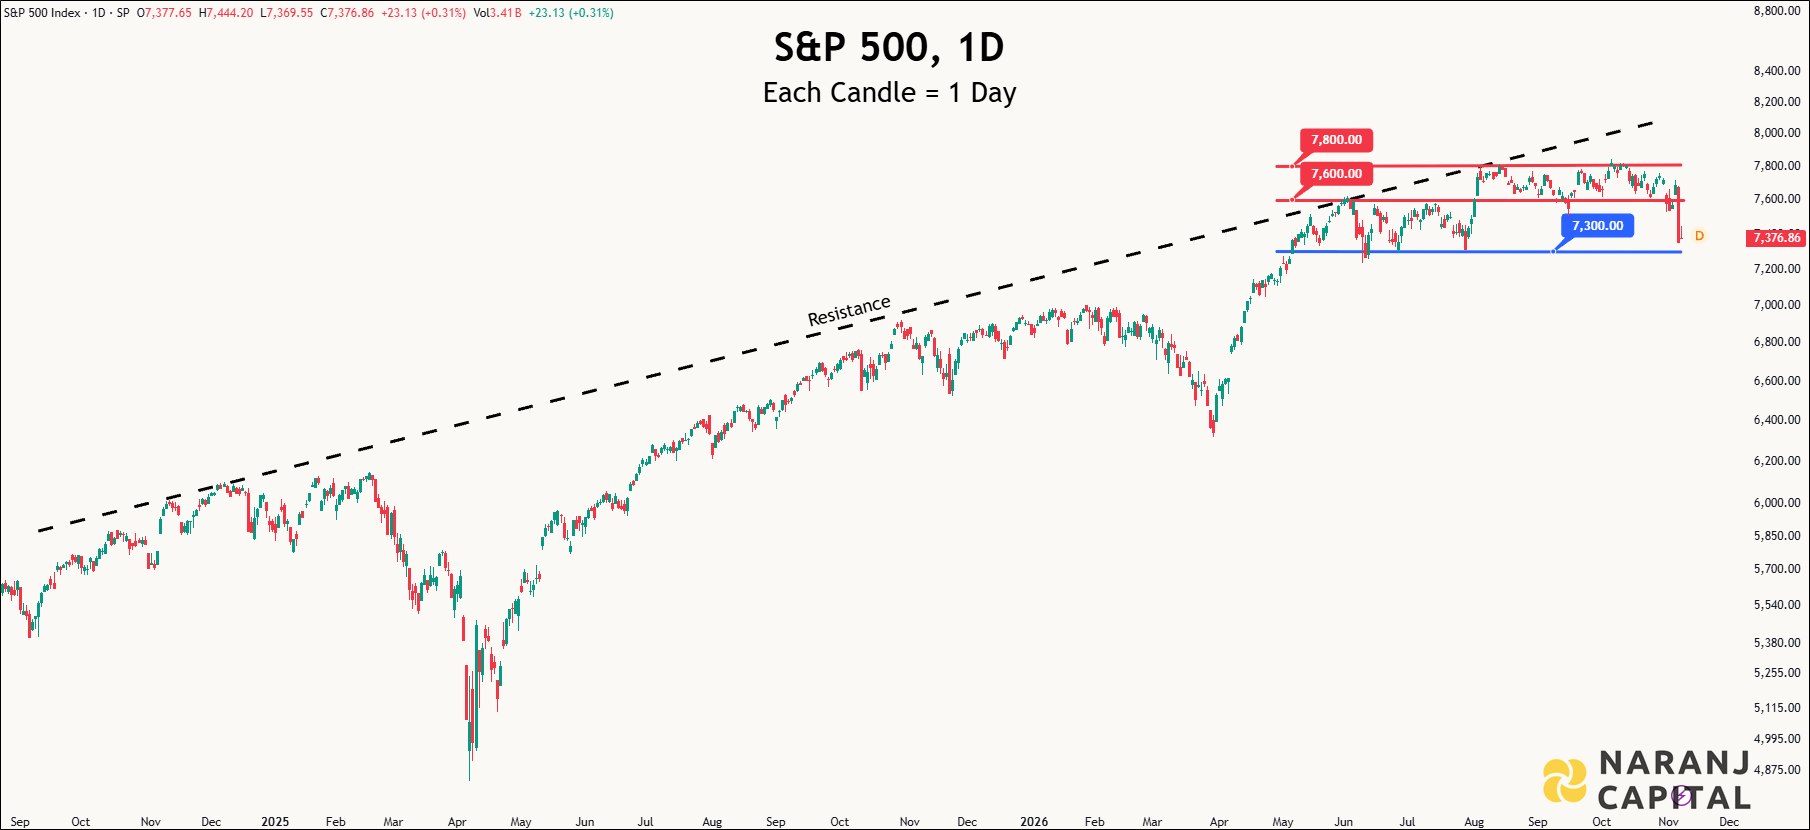
The S&P 500 fell 2.68%, closing Friday at 7,376.86, following a brutal 4.4% single-day decline on Thursday.
Technology and semiconductor stocks took the biggest hit.
What went wrong?
A combination of political uncertainty following the US midterm elections, growing concerns over AI investments and renewed interest-rate worries.
But the bigger question is:
Is this just a temporary correction, or the beginning of something bigger?
Let's look at what matters this week. 👇
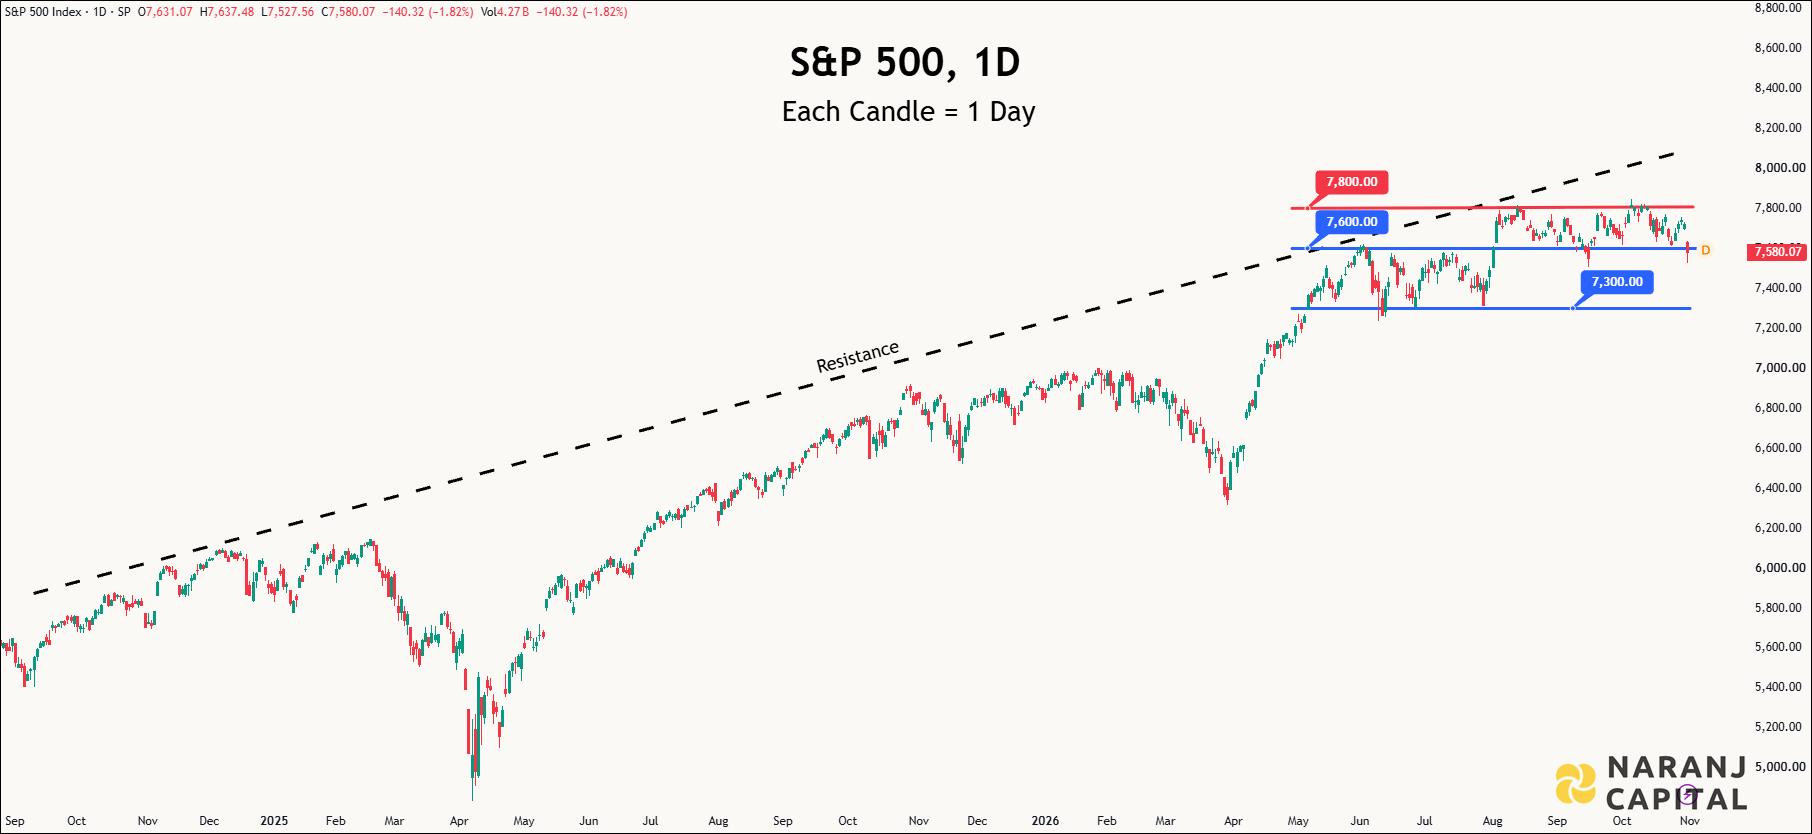
The daily chart shows the index approaching a crucial support zone.
🔴 7,800 – Major Resistance: A recovery towards the previous record high would require stronger market momentum.
🟡 7,600 – Immediate Resistance: Reclaiming this level would be the first meaningful sign of recovery.
🔵 7,300 – Critical Support: The most important level right now. A decisive break below it could open the door to a deeper correction.
🟢 Bullish: If inflation data is supportive and AI earnings remain strong, the index could hold above 7,300 and recover towards 7,500–7,600.
🔴 Bearish: Hot inflation or disappointing AI results could push the index below 7,300, increasing the risk of a deeper correction.
After such a sharp sell-off, chasing a quick recovery can be risky.
Watch how the index behaves around 7,300. Avoid aggressive positioning until buyers show stronger conviction.
Capital protection comes first.
The market is facing a crucial test.
7,300 is the level bulls need to defend.
7,600 is the level they need to reclaim.
Until then, caution makes sense.
Is this a healthy correction in a longer-term bull market, or are we heading towards a deeper decline?
Let's hear your thoughts.