Etisalat – Continuous Pole > Flag > Breakthrough Formation
Naranj Capital Research Desk
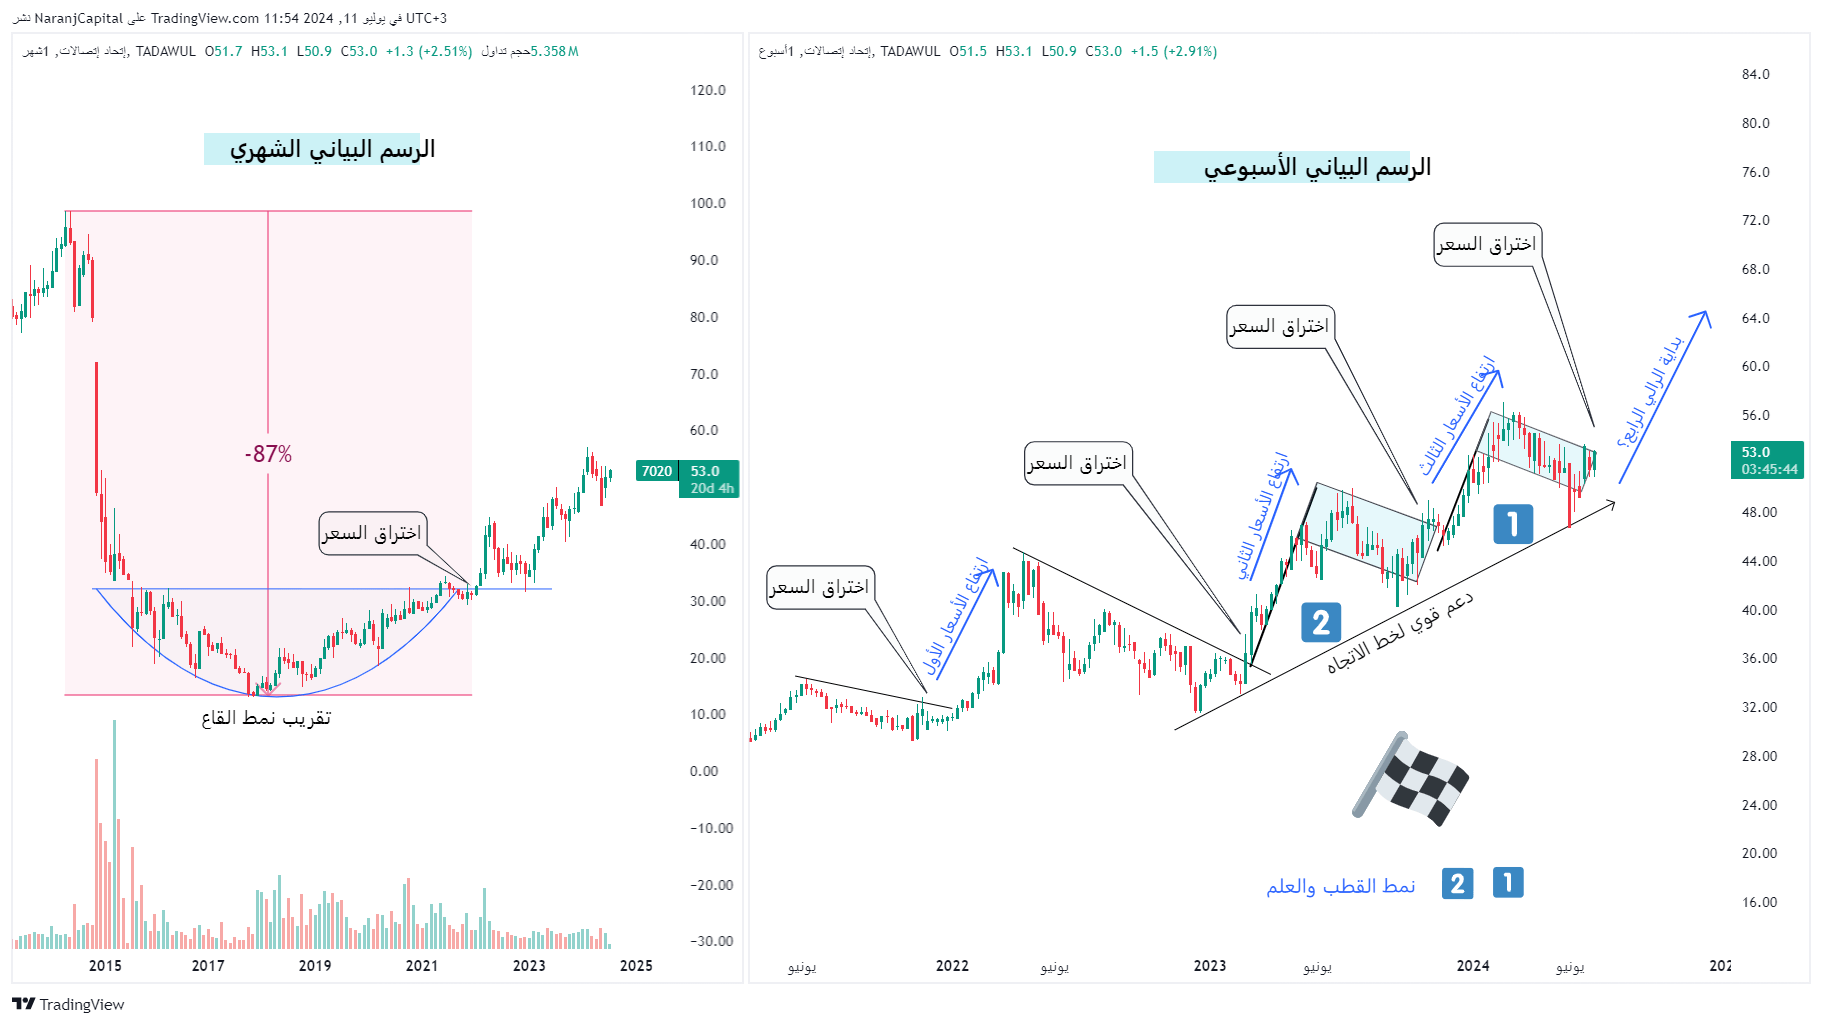
Monthly Price Chart
The stock experienced a significant drop, correcting by nearly 87% from its peak.
After stabilizing around the 13 SAR, the stock price started to moving upwards.
After a successful breakout from the Rounding Bottom Pattern, the price surged again, reaching near 50.
Weekly Price Chart
We have noticed continious Flag & Pole formation in the weekly chart.
During this continious formation, the stock price experienced a sharp movement (the pole), followed by a period of consolidation within a defined price range (the flag).
Another Flag & Pole pattern is currently developing in the chart. We expect a breakout from this range eventually, typically in the direction of the initial price move, suggests the uptrend will continue in the near future.