Tadawul trade advice (B): Saudi capital goods stock | 5-6% gain | KSA stock trading signal on 27 Oct 2026

Date
October 27, 2026
Analysed By
Naranj Capital Research Desk
Stock Market
Tadawul, Saudi Arabia
  • Buy
  • Buy
    Range
  • Target
  • Stoploss
  • Upside
    Potential
  • Trade
    Duration
  • Raoom Trading
  • 69 - 71.5
  • 75 - 76
  • Below 66.5
  • 5% – 6%
  • 12 - 14 Days
  • Buy Raoom Trading
  • Buy
    Range
    69 - 71.5
  • Target 75 - 76
  • Stoploss Below 66.5
  • Upside
    Potential
    5% – 6%
  • Trade
    Duration
    12 - 14 Days
  • Buy
  • Buy
    Range
  • Target
  • Stoploss
  • Upside
    Potential
  • Trade
    Duration
  • Raoom Trading
  • 69 - 71.5
  • 75 - 76
  • Below 66.5
  • 5% – 6%
  • 12 - 14 Days
  • Locked Image
    Locked Image
    Locked Image
    Locked Image

    5% – 6%

    12 - 14 Days

  • Buy
    Raoom Trading
  • Buy
    Range
    69 - 71.5
  • Target
    75 - 76
  • Stoploss
    Below 66.5
  • Upside
    Potential
    5% – 6%
  • Trade
    Duration
    12 - 14 Days
  • Locked Image
    Locked Image
    Locked Image
    Locked Image

    5% – 6%

    12 - 14 Days

    * Once the first target hit, reset the StopLoss at your buying price.
    * Trade durations are approximate; actual holding period may vary.

    Tadawul 4144 : Raoom Trading - Stock Overview

  • Tadawul code
  • Stock Name
  • Sector
  • 52 Weeks High
  • 52 Weeks Low
  • 4144
  • RAOOM
  • Capital Goods
  • 85.25
  • 52.00
  • Tadawul code 4144
  • Stock Name RAOOM
  • Sector Capital Goods
  • 52 Weeks High 85.25
  • 52 Weeks Low 52.00
  • Company profile

    Raoom Trading Company, founded in 1988, is a Saudi Arabian company based in Buraydah. It manufactures, sells, and installs glass, mirrors, and aluminum products for various applications.

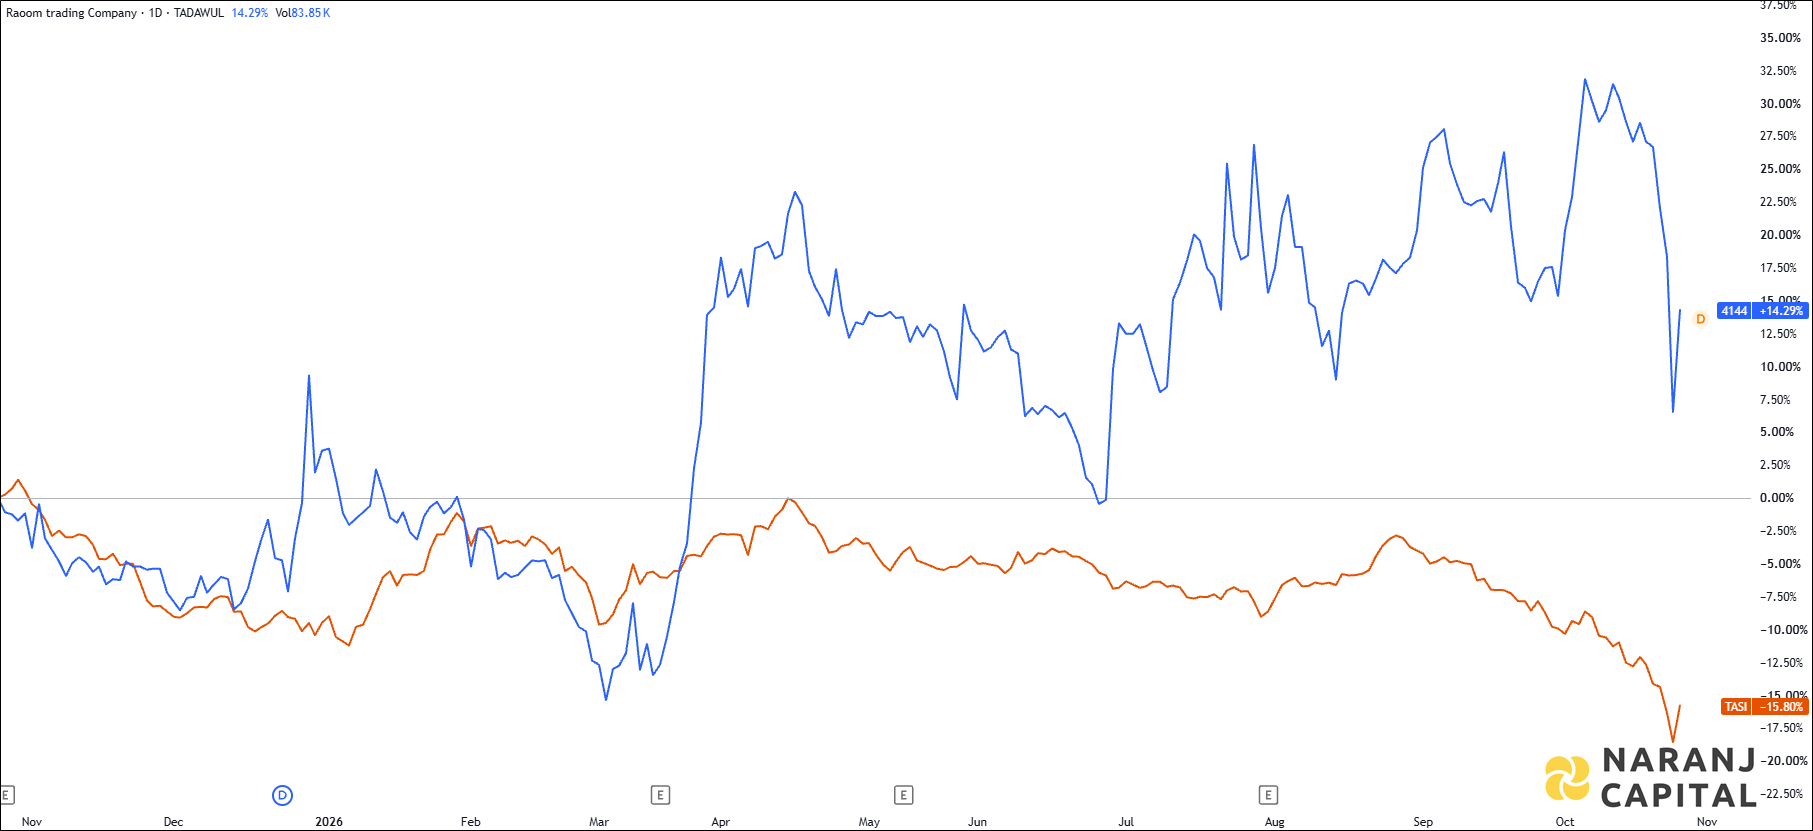
  • Tadawul 4144 : Raoom Trading vs TASI - Relative Performance

    The image highlights Raoom Trading's performance over the last year versus TASI.
    Relative Performance - Last 1 Year
    RAOOM —   TASI —

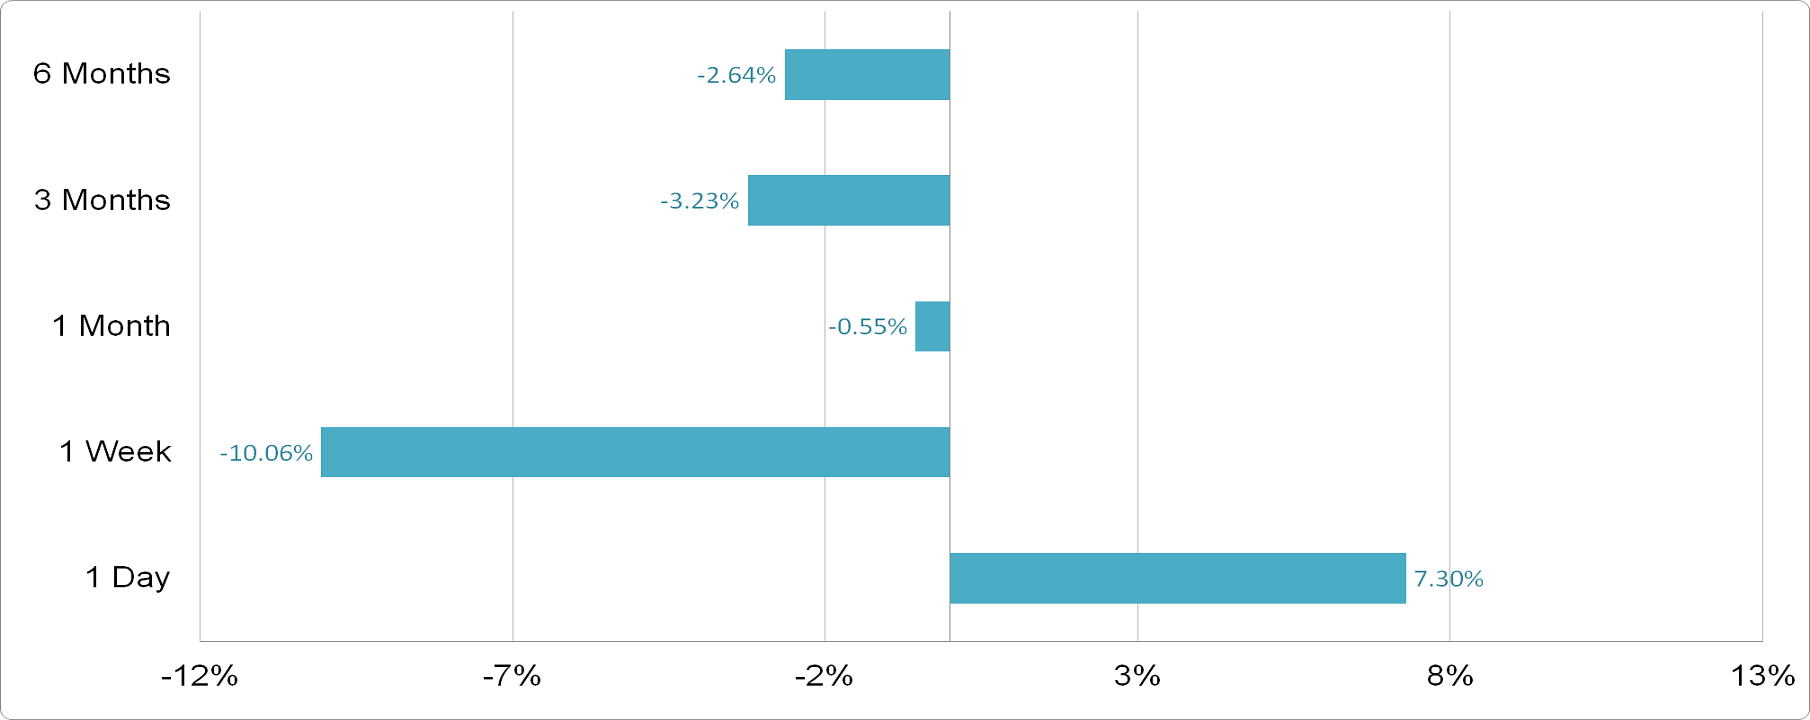
  • Tadawul 4144 : Raoom Trading - Price Performance

    Raoom Trading - Price Performance
    Raoom Trading - Price Performance

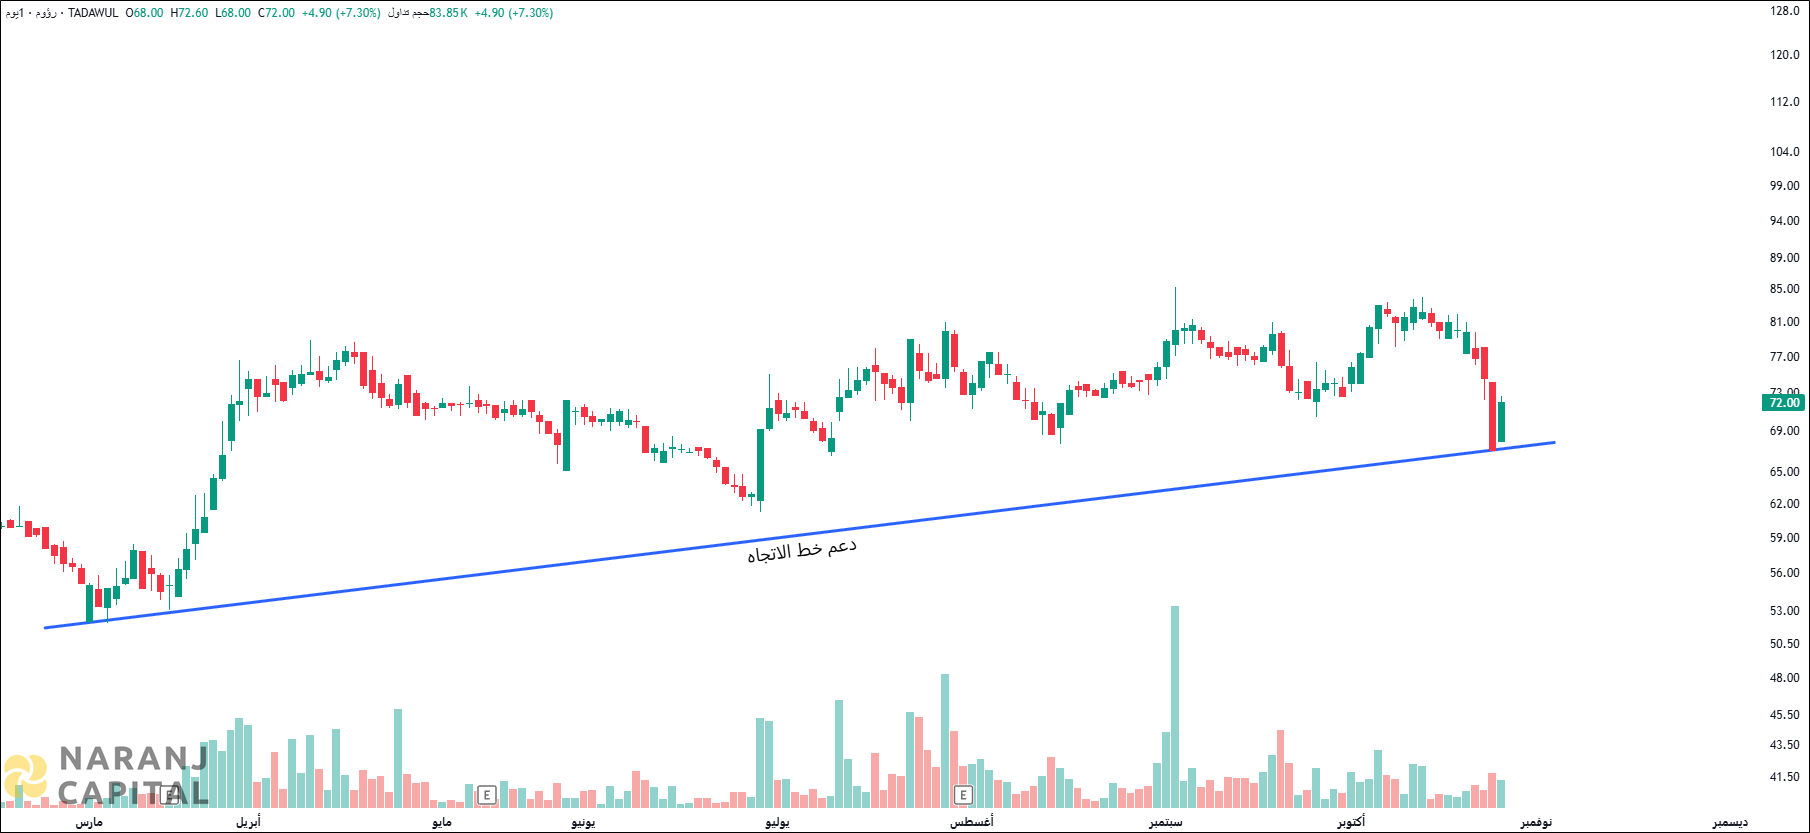
  • Tadawul 4144 : Raoom Trading - Technical Analysis (Daily)

    Raoom Trading - Technical is chart on Daily Price and Volume
    Raoom Trading - Technical is chart on Daily Price and Volume

    • Ascending trendline support holding – Price has respected a well-defined rising trendline throughout the year, with each successive low remaining higher, preserving the overall bullish trend structure.
    • Sharp pullback to trendline – A recent aggressive selloff has brought price directly back to the ascending trendline support, creating a high-interest demand zone where buyers have historically emerged.
    • Trendline bounce setting up – Price is touching the trendline with a notable green close today suggesting early buying response. Expected to bounce and resume bullish momentum from current levels.
  • Tadawul 4144 : Raoom Trading - Oscillators

    Indicator Value Zone
    RSI-14 40.18 Neutral
    CCI-14 -165.69 Oversold
    Stochastic RSI 11.35 Oversold
    ROC -13.31 Negative
    William %R -71.01 Neutral

  • Tadawul 4144 : Raoom Trading - Exponential Moving Averages (EMAs)

    EMA Value Stock Position
    5 EMA 73.42 Below
    10 EMA 75.77 Below
    20 EMA 77.02 Below
    50 EMA 76.49 Below
    100 EMA 74.47 Below
    200 EMA 71.72 Above

  • Conclusion - Tadawul 4144 : Raoom Trading Stock Price Forecast

    Based on our Saudi stocks trading guidance, Raoom Trading stock price target will be SAR 75 - SAR 75 in the next 12-14 trading sessions.

  • Share with
    0 0 votes
    Article Rating
    Subscribe
    Notify of
    guest
    0 Comments

    Join Our Telegram Channel for Saudi Stock Market Update

    Join Naranj Capital on Telegram for free stock alerts

    Saudi Stocks Analysis