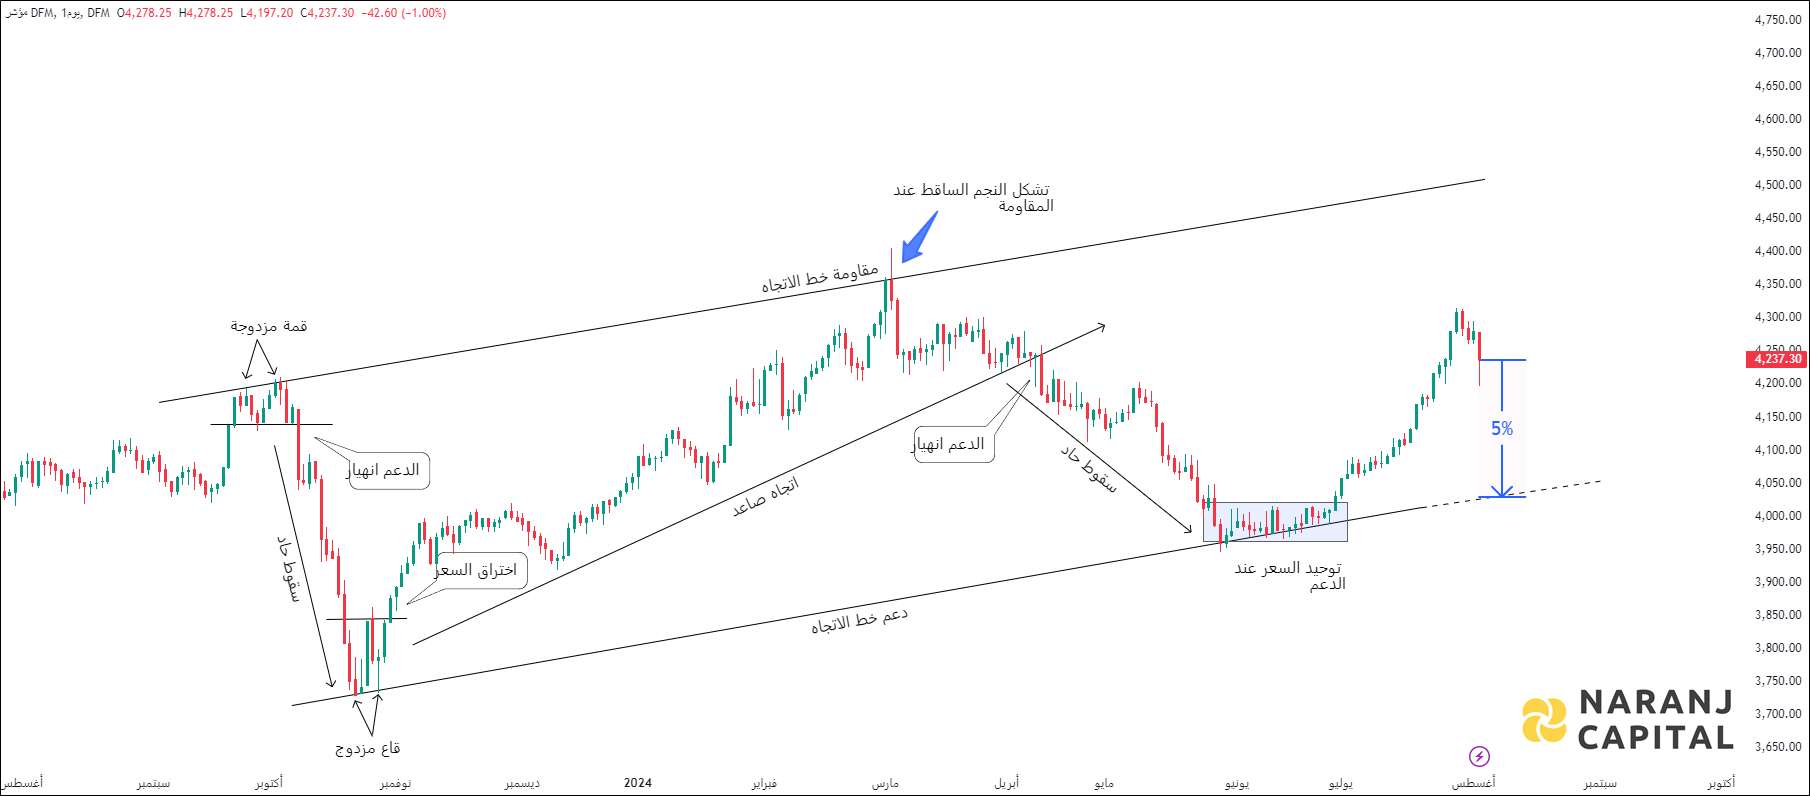
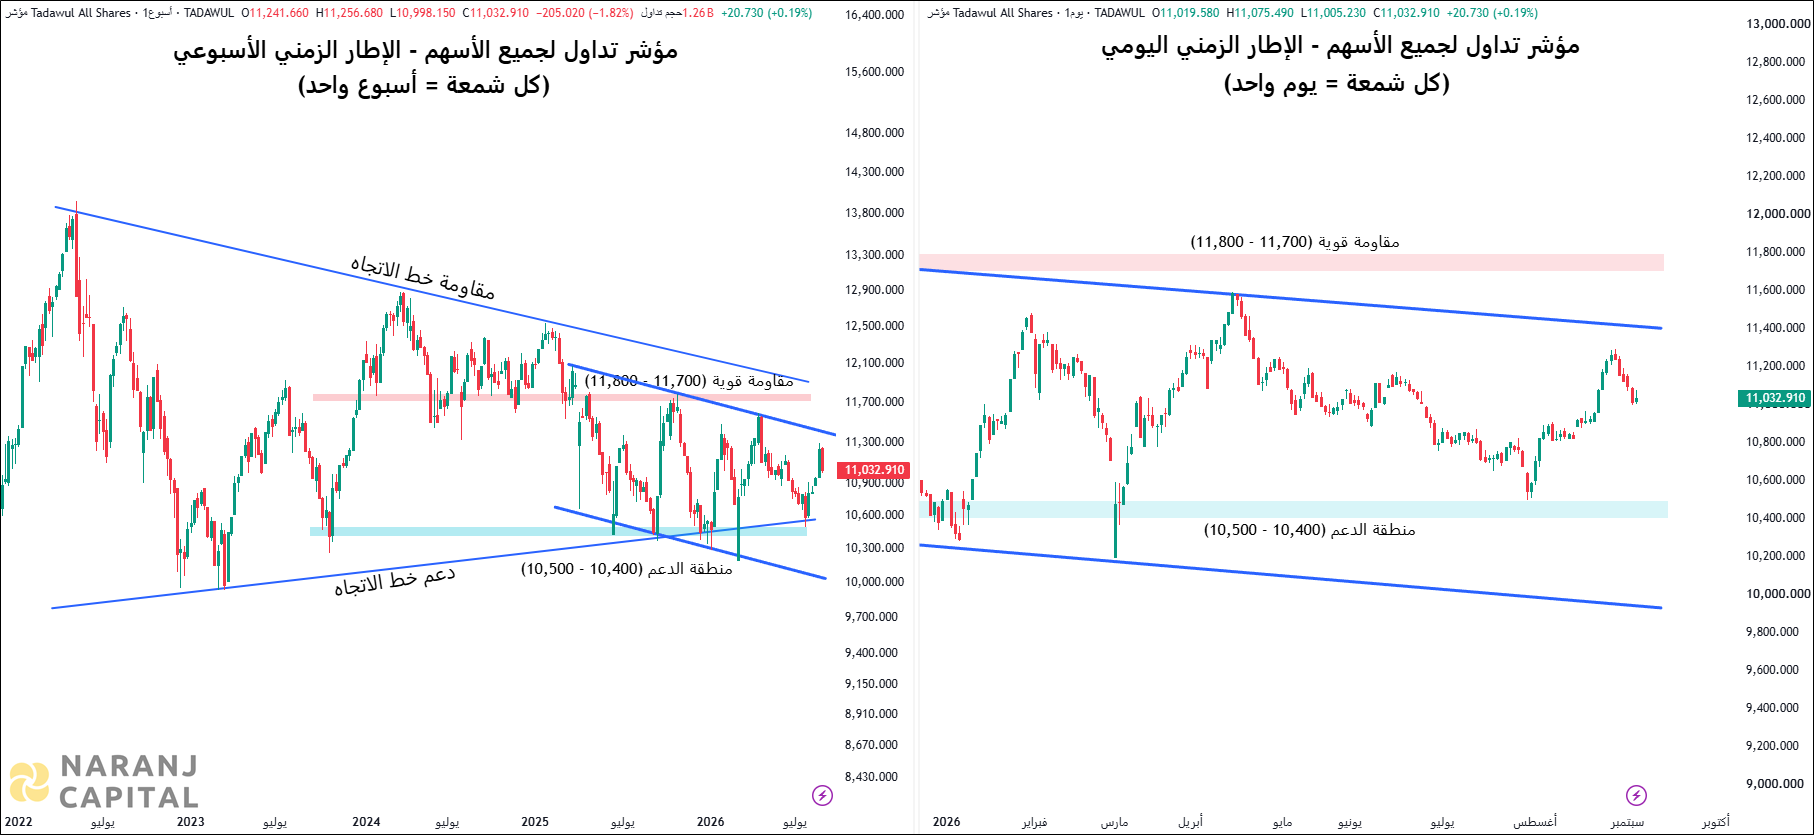
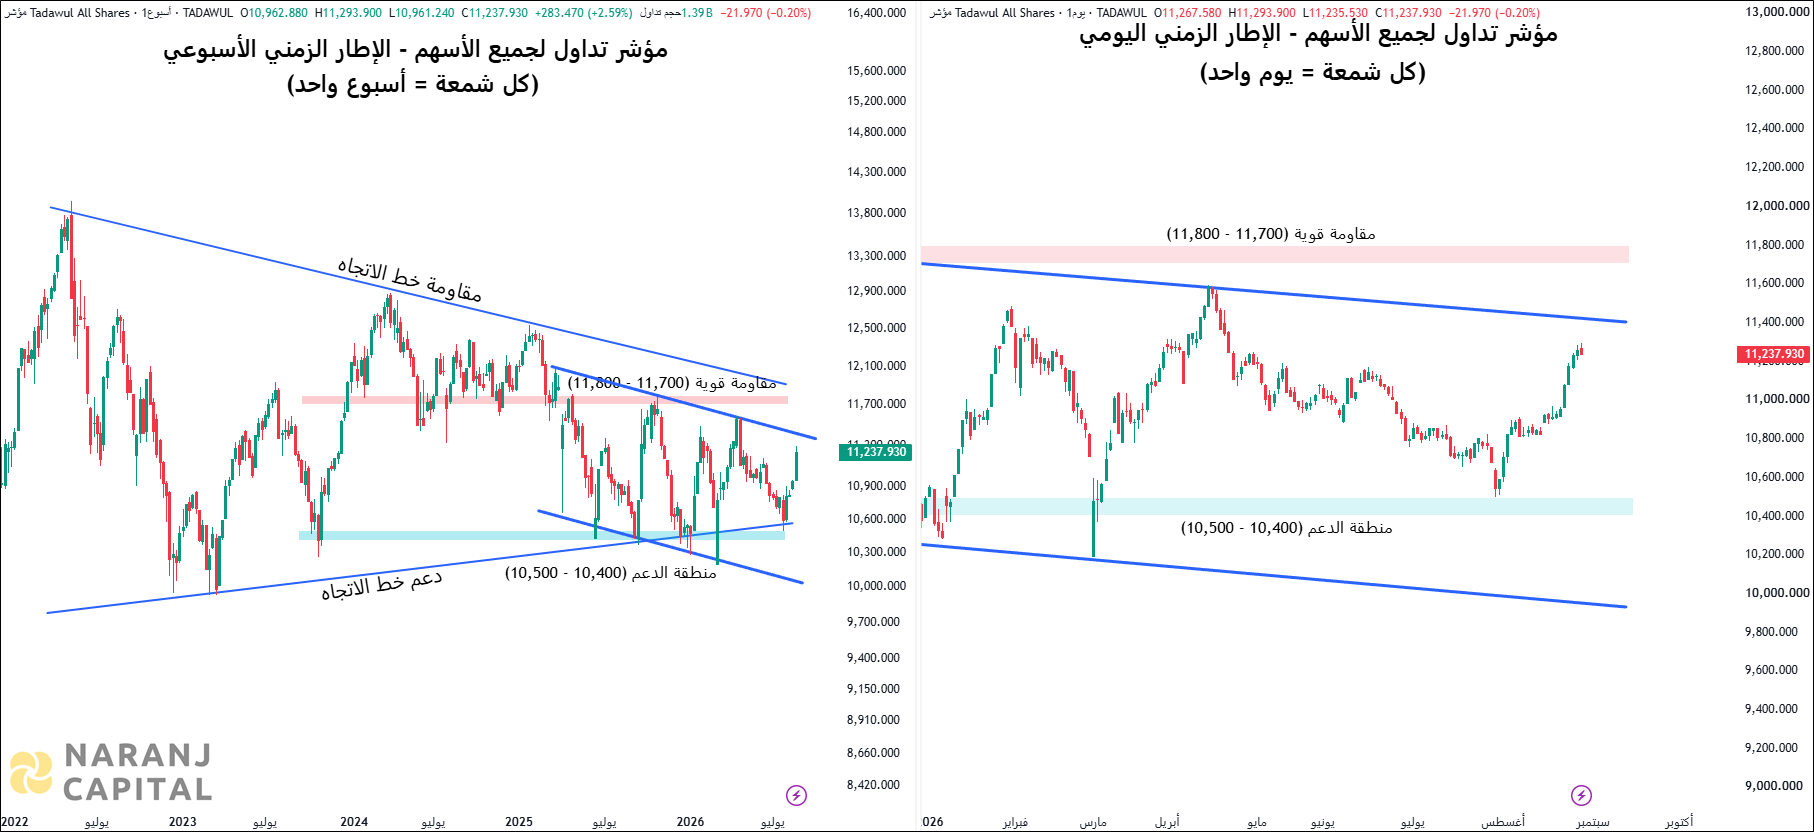
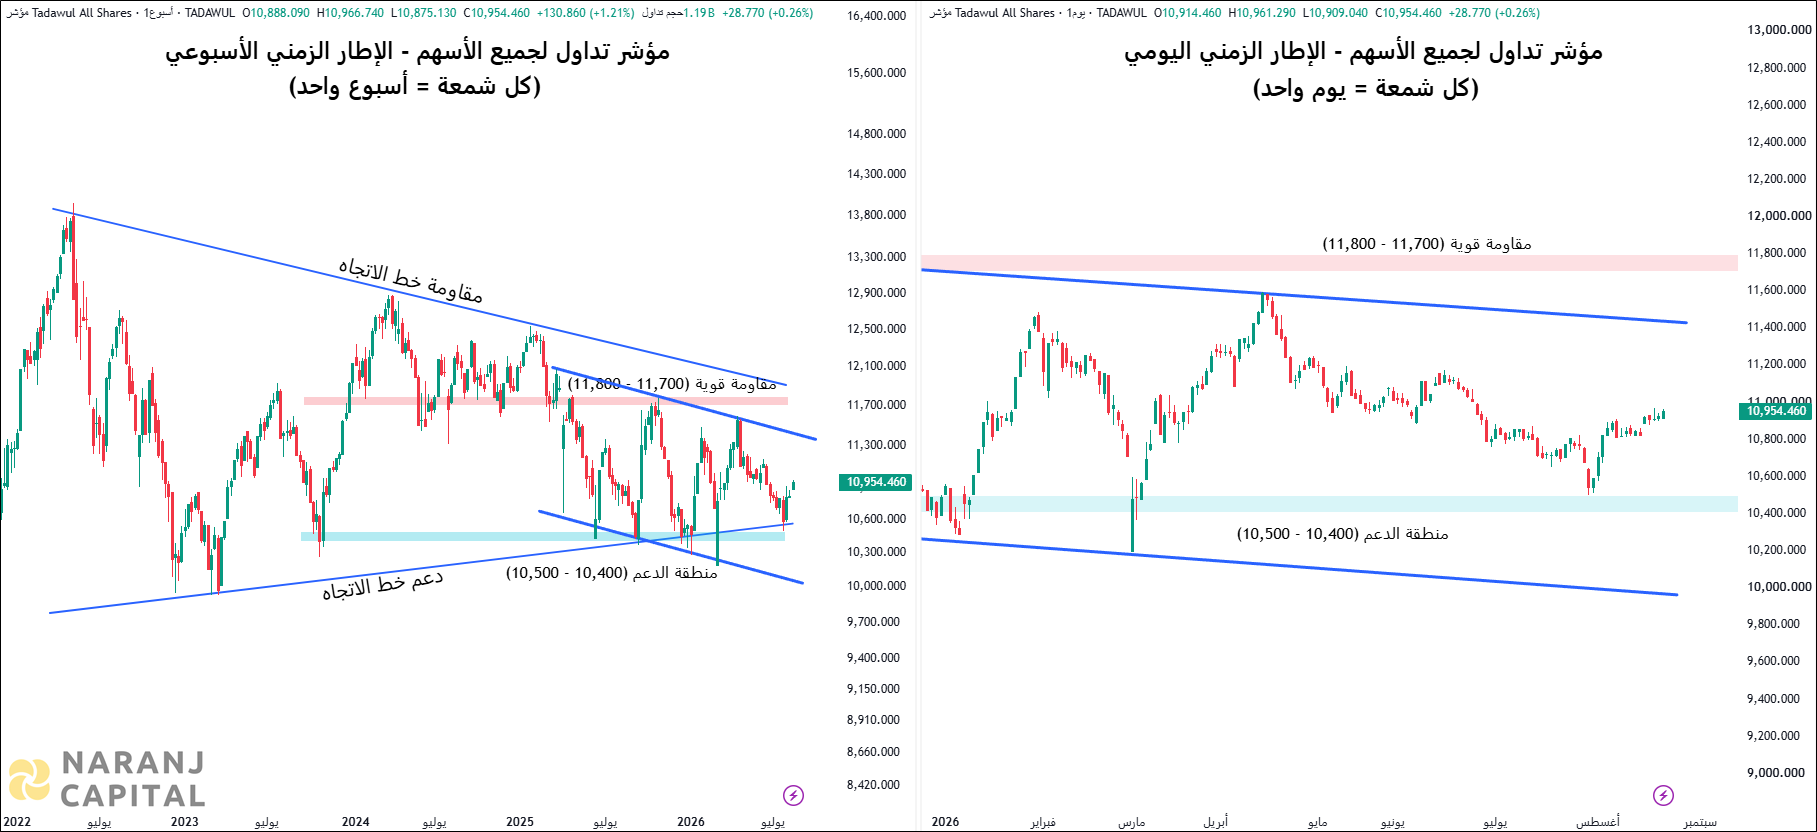
The index faced resistance near the 4,200 mark, leading to the formation of a Double Top pattern.
Once this pattern was breached, the index experienced a notable decline, approaching the 3,730 level.
After establishing a Double Bottom pattern, the DFMGI surged past the neckline, initiating a series of higher highs and lows.
However, despite attempts to surpass the trendline resistance, the index was unable to break through.
A shooting star candle triggered a sharp correction for the DFMGI, pulling it down to the trendline support zone.
Following a period of consolidation, the index started to rise again, but it has been on a downward trend for the past four days, potentially heading back to its trendline support level.
Share with
00votes
Article Rating
Subscribe
0 Comments
Join Our Telegram Channel for Saudi Stock Market Update