NYSE trade advice (A): US retail stock | 4-5% gain | USA stock trading signal on 21 Apr 2026

Date
April 21, 2026
Analysed By
Naranj Capital Research Desk
Stock Market
NYSE, United States of America

Trading Tips for US Stocks

  • Buy
  • Buy
    Range
  • Target
  • Stoploss
  • Upside
    Potential
  • Trade
    Duration
  • Target Corporation
  • 128 - 130
  • 135 - 136
  • Below 126
  • 4% – 5%
  • 12 - 14 Days
  • Locked Image
    Locked Image
    Locked Image
    Locked Image

    4% – 5%

    12 - 14 Days

  • Buy
    Target Corporation
  • Buy
    Range
    128 - 130
  • Target
    135 - 136
  • Stoploss
    Below 126
  • Upside
    Potential
    4% – 5%
  • Trade
    Duration
    12 - 14 Days
  • Locked Image
    Locked Image
    Locked Image
    Locked Image

    4% – 5%

    12 - 14 Days

    * Once the first target hit, reset the StopLoss at your buying price.

    Target Corporation (NYSE: TGT) - Stock Overview

  • NYSE code
  • Stock Name
  • Sector
  • 52 Weeks High
  • 52 Weeks Low
  • TGT
  • Target Corporation
  • Retail Stores
  • 130.19
  • 83.44
  • NYSE code TGT
  • Stock Name Target Corporation
  • Sector Retail Stores
  • 52 Weeks High 130.19
  • 52 Weeks Low 83.44
  • Target Corporation (NYSE: TGT) - Q4 FY25 Financials Highlights

    Metric Q4 FY25 Q3 FY25 QoQ Change Q4 FY24 YoY Change
    Revenue $31,200M $25,400M 22.80% $30,600M 2.00%
    EBITDA $2,850M $2,100M 35.70% $2,700M 5.60%
    EBITDA Margin 9.10% 8.30% +80 bps 8.8% +30 bps
    Operating Cash Flow $3,400M $2,600M 30.80% $3,100M 9.70%
    Free Cash Flow $2,200M $1,500M 46.70% $2,000M 10.00%
    Comparable Sales Growth 3.50% 2.10% +140 bps 3.0% +50 bps

  • Target Corporation (NYSE: TGT) - Earnings Call Summary for Q4/2025

    • Q4 was mixed but better than expected, with profit beating estimates even though sales were still slightly down YoY.
    • Business trends improved through the quarter, with December-January better than November and February starting on a healthier note.
    • Margins improved due to lower shrink, better cost control, and support from ad and other non-merchandise income.
    • Essentials performed better, while discretionary demand stayed uneven.
    • Management guided for a return to growth in FY27, backed by higher investments and better expected performance in the second half.
  • Target Corporation (NYSE: TGT) vs NYSE - Relative Performance

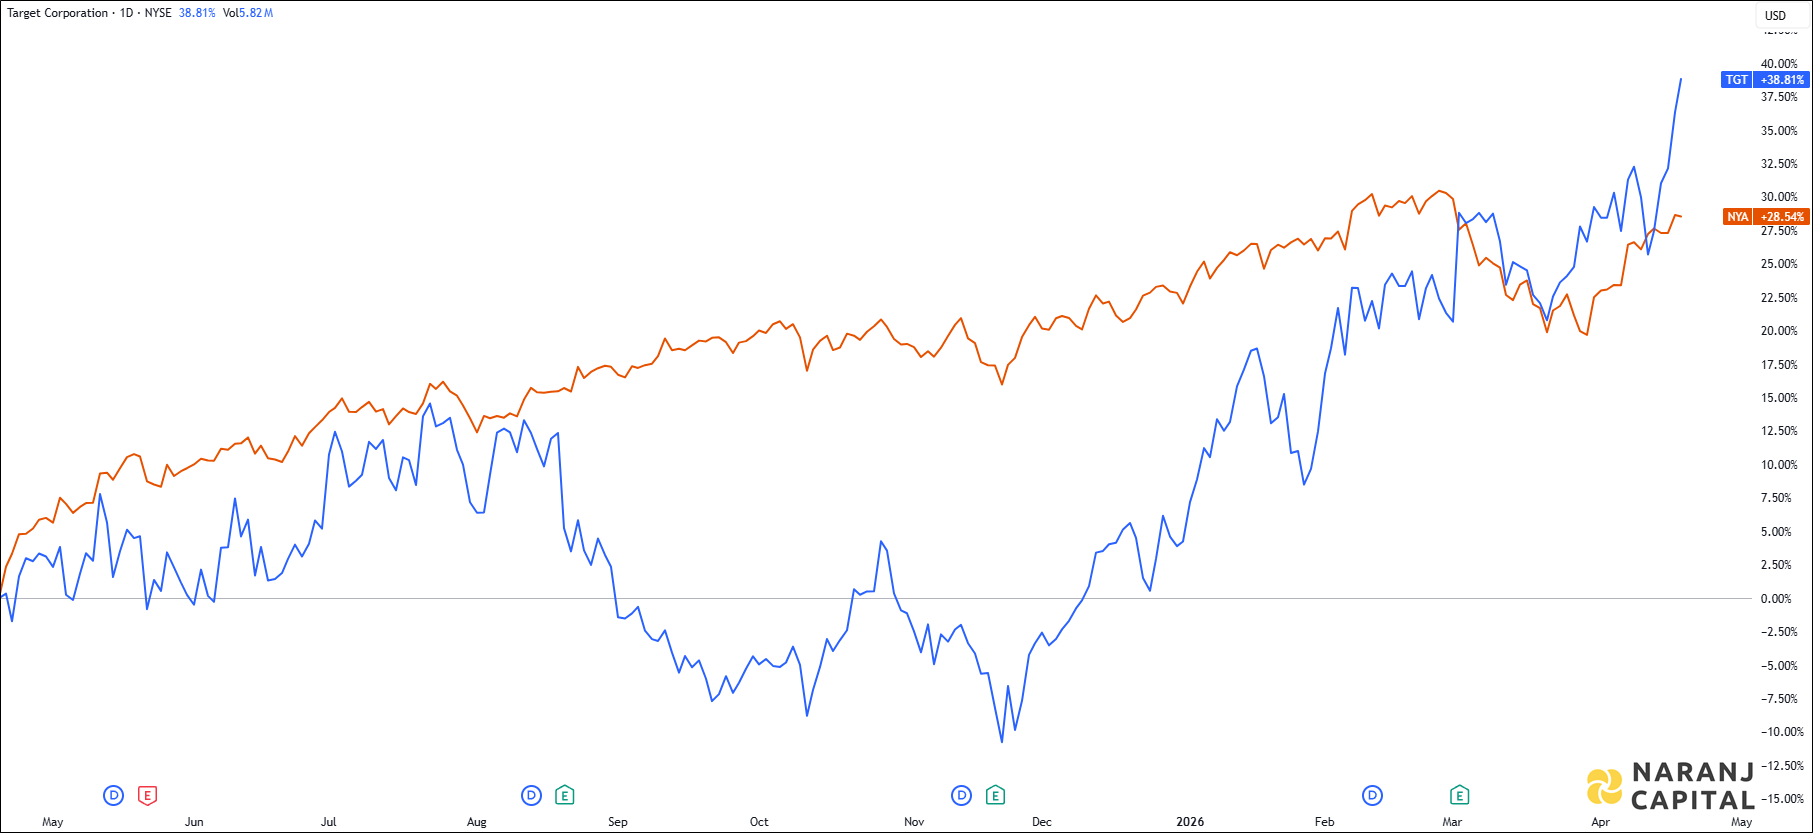
    The image showcases Target Corporation's 1-year performance relative to NYSE.
    Relative Performance - Last 1 Year
    TGT —   NYSE —

  • Target Corporation (NYSE: TGT) - Price Performance

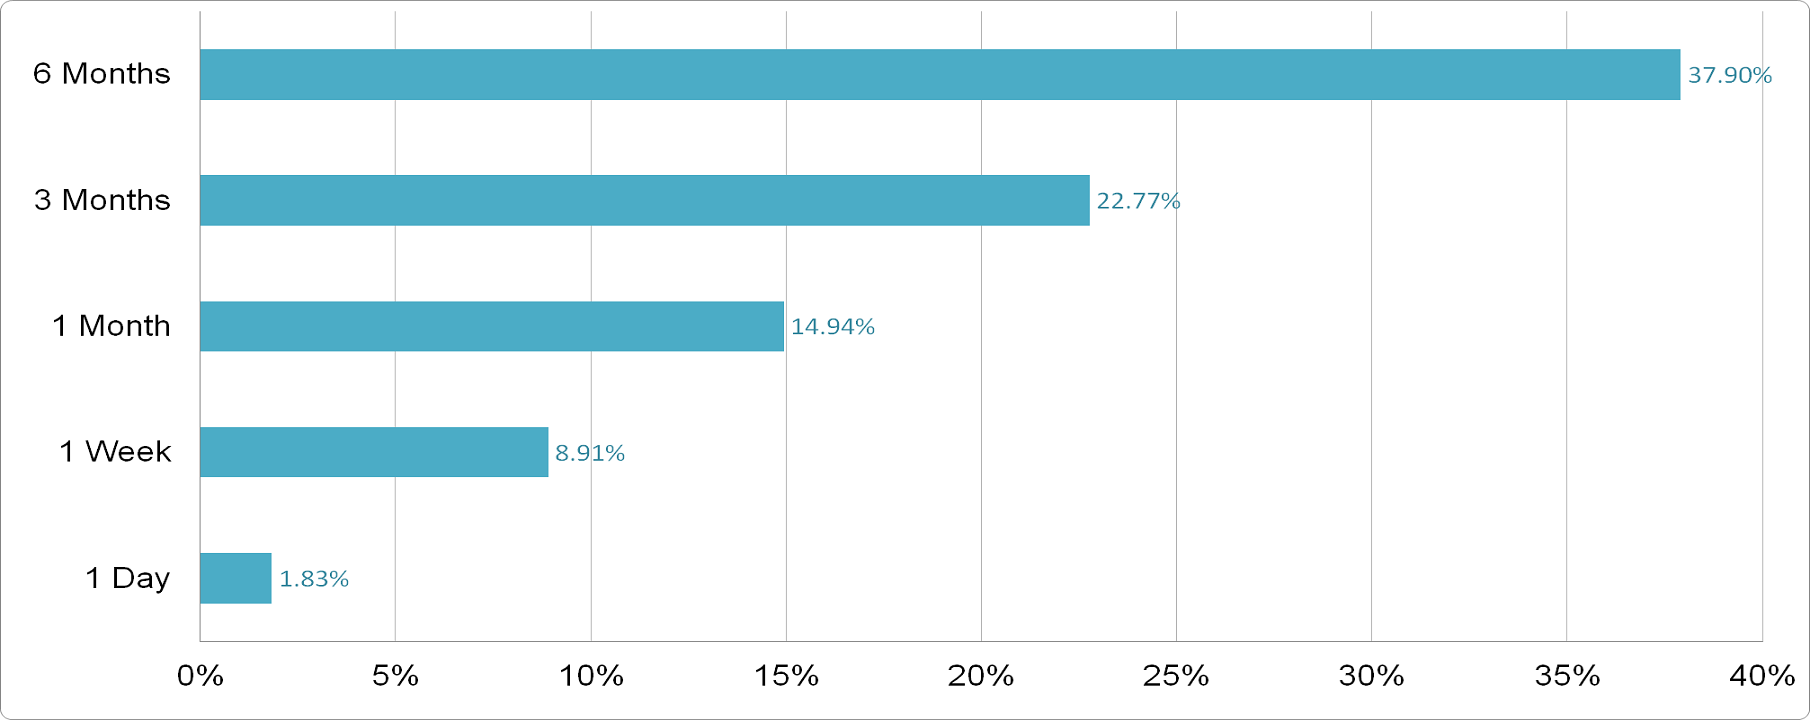
    Target Corporation - Price Performance
    Target Corporation - Price Performance

  • Target Corporation (NYSE: TGT) - Technical Analysis (Daily)

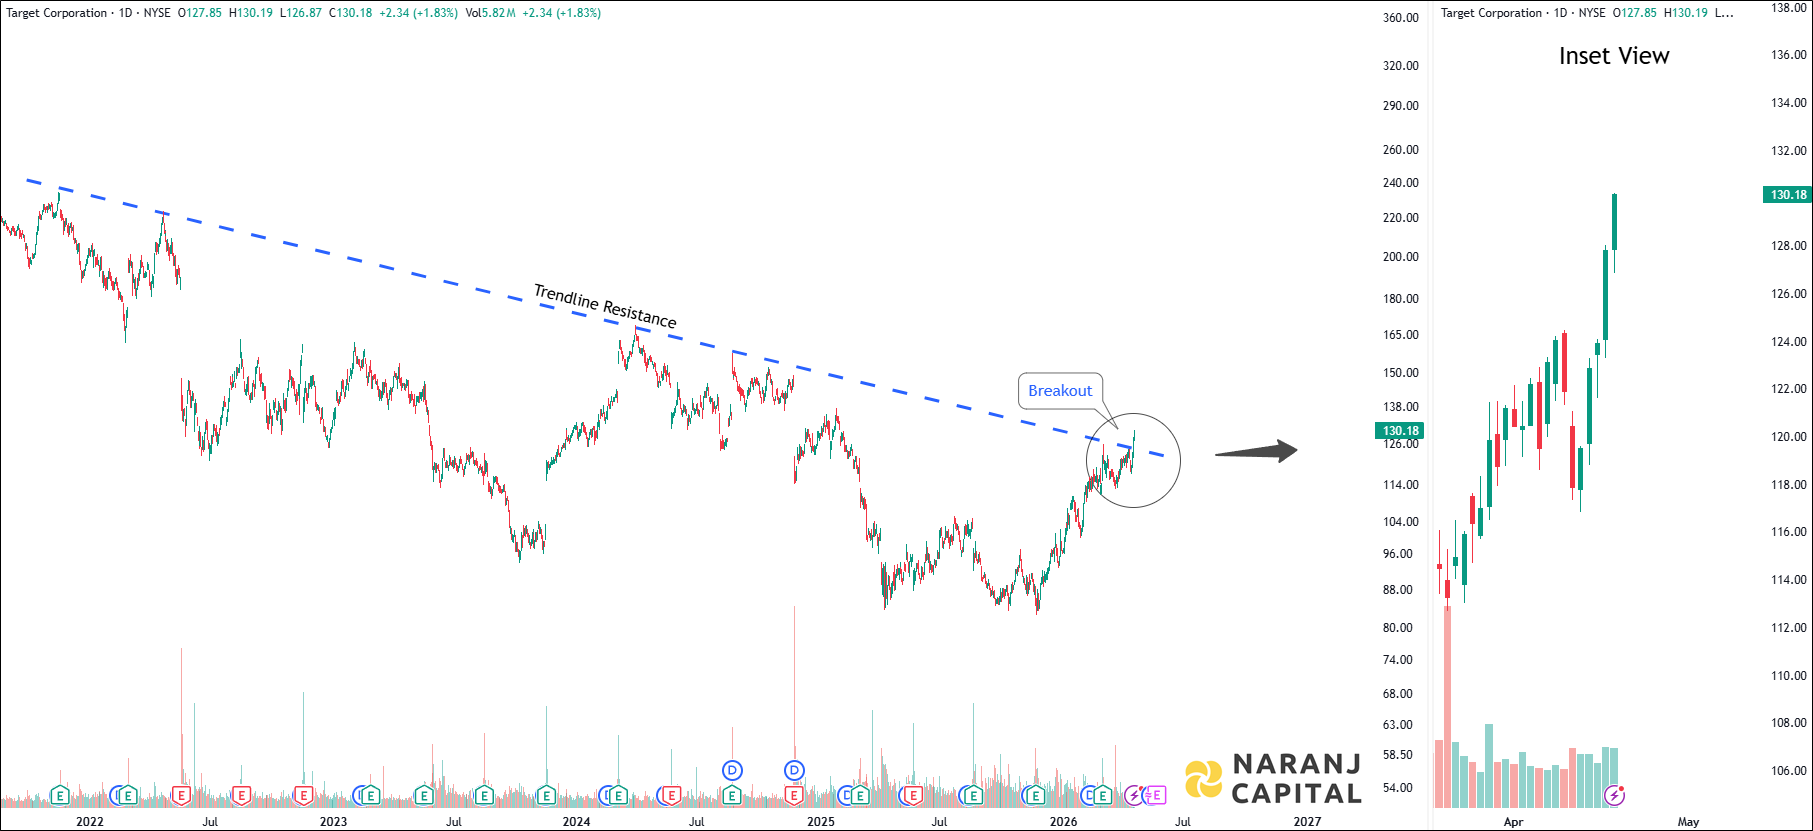
    Target Corporation - Daily Technical Analysis
    Target Corporation - Daily Technical Analysis

    • The stock price has broken above its long-term trendline resistance, indicating a potential trend reversal. It is now positioned for a fresh upside move, with bullish momentum likely to build from current levels.
  • Target Corporation (NYSE: TGT) - Oscillators

    Indicator Value Zone
    RSI-14 68.50 Neutral
    CCI-14 261.21 Overbought
    ROC 9.61 Positive
    Stochastic RSI 100.00 Overbought
    William %R 0.00 Overbought

  • Target Corporation (NYSE: TGT) - Exponential Moving Averages (EMAs)

    EMA Value Stock Position
    5 EMA 126.26 Above
    10 EMA 123.86 Above
    20 EMA 121.88 Above
    50 EMA 117.14 Above
    100 EMA 111.87 Above
    200 EMA 109.36 Above

  • Conclusion - Target Corporation (NYSE: TGT) Stock Price Forecast

    Based on our US swing trading stocks, Target Corporation stock price target will be USD 135 - USD 136 in the next 12-14 trading sessions.

  • Share with
    0 0 votes
    Article Rating
    Subscribe
    Notify of
    guest
    0 Comments
    Join Our Telegram Channel for Saudi Stock Market Update
    Saudi Stock Analysis
    Join Our Telegram Channel for USA Stock Analysis Update
  • Buy
  • Buy
    Range
  • Target
  • Stoploss
  • Upside
    Potential
  • Trade
    Duration
  • Target Corporation
  • 128 - 130
  • 135 - 136
  • Below 126
  • 4% – 5%
  • 12 - 14 Days
  • Buy Target Corporation
  • Buy
    Range
    128 - 130
  • Target 135 - 136
  • Stoploss Below 126
  • Upside
    Potential
    4% – 5%
  • Trade
    Duration
    12 - 14 Days
  • Buy
  • Buy
    Range
  • Target
  • Stoploss
  • Upside
    Potential
  • Trade
    Duration
  • Target Corporation
  • 128 - 130
  • 135 - 136
  • Below 126
  • 4% – 5%
  • 12 - 14 Days
  • Locked Image
    Locked Image
    Locked Image
    Locked Image

    4% – 5%

    12 - 14 Days

  • Buy
    Target Corporation
  • Buy
    Range
    128 - 130
  • Target
    135 - 136
  • Stoploss
    Below 126
  • Upside
    Potential
    4% – 5%
  • Trade
    Duration
    12 - 14 Days
  • Locked Image
    Locked Image
    Locked Image
    Locked Image

    4% – 5%

    12 - 14 Days

    * Once the first target hit, reset the StopLoss at your buying price.
    * Trade durations are approximate; actual holding period may vary.

    Target Corporation (NYSE: TGT) - Stock Overview

  • NYSE code
  • Stock Name
  • Sector
  • 52 Weeks High
  • 52 Weeks Low
  • TGT
  • Target Corporation
  • Retail Stores
  • 130.19
  • 83.44
  • NYSE code TGT
  • Stock Name Target Corporation
  • Sector Retail Stores
  • 52 Weeks High 130.19
  • 52 Weeks Low 83.44
  • Company profile

    Target Corporation is a large retail company in the United States, founded in 1902 and headquartered in Minneapolis. It sells a wide range of products including clothing, groceries, electronics, home items, beauty products, and daily essentials. The company operates through physical stores and its online platform, Target.com, making it a one-stop shop for everyday needs.

  • Target Corporation (NYSE: TGT) - Q4 FY25 Financials Highlights

    Metric Q4 FY25 Q3 FY25 QoQ Change Q4 FY24 YoY Change
    Revenue $31,200M $25,400M 22.80% $30,600M 2.00%
    EBITDA $2,850M $2,100M 35.70% $2,700M 5.60%
    EBITDA Margin 9.10% 8.30% +80 bps 8.8% +30 bps
    Operating Cash Flow $3,400M $2,600M 30.80% $3,100M 9.70%
    Free Cash Flow $2,200M $1,500M 46.70% $2,000M 10.00%
    Comparable Sales Growth 3.50% 2.10% +140 bps 3.0% +50 bps

  • Target Corporation (NYSE: TGT) - Earnings Call Summary for Q4/2025

    • Q4 was mixed but better than expected, with profit beating estimates even though sales were still slightly down YoY.
    • Business trends improved through the quarter, with December-January better than November and February starting on a healthier note.
    • Margins improved due to lower shrink, better cost control, and support from ad and other non-merchandise income.
    • Essentials performed better, while discretionary demand stayed uneven.
    • Management guided for a return to growth in FY27, backed by higher investments and better expected performance in the second half.
  • Target Corporation (NYSE: TGT) vs NYSE - Relative Performance

    The image showcases Target Corporation's 1-year performance relative to NYSE.
    Relative Performance - Last 1 Year
    TGT —   NYSE —

  • Target Corporation (NYSE: TGT) - Price Performance

    Target Corporation - Price Performance
    Target Corporation - Price Performance

  • Target Corporation (NYSE: TGT) - Technical Analysis (Daily)

    Target Corporation - Daily Technical Analysis
    Target Corporation - Daily Technical Analysis

    • The stock price has broken above its long-term trendline resistance, indicating a potential trend reversal. It is now positioned for a fresh upside move, with bullish momentum likely to build from current levels.
  • Target Corporation (NYSE: TGT) - Oscillators

    Indicator Value Zone
    RSI-14 68.50 Neutral
    CCI-14 261.21 Overbought
    ROC 9.61 Positive
    Stochastic RSI 100.00 Overbought
    William %R 0.00 Overbought

  • Target Corporation (NYSE: TGT) - Exponential Moving Averages (EMAs)

    EMA Value Stock Position
    5 EMA 126.26 Above
    10 EMA 123.86 Above
    20 EMA 121.88 Above
    50 EMA 117.14 Above
    100 EMA 111.87 Above
    200 EMA 109.36 Above

  • Conclusion - Target Corporation (NYSE: TGT) Stock Price Forecast

    Based on our US swing trading stocks, Target Corporation stock price target will be USD 135 - USD 136 in the next 12-14 trading sessions.

  • Share with
    0 0 votes
    Article Rating
    Subscribe
    Notify of
    guest
    0 Comments

    Join Our Telegram Channel for USA Stock Market Update

    USA Stock Analysis

    Details of Arijit Banerjee

    Arijit Banerjee CMT CFTe is a seasoned expert in the financial industry, boasting decades of experience in trading, investment, and wealth management. As the founder and chief strategist of Naranj Capital, he’s built a reputation for providing insightful research analysis to guide investment decisions.

    Arijit’s credentials are impressive, holding both the Chartered Market Technician (CMT) and Certified Financial Technician (CFTe) designations. These certifications demonstrate his expertise in technical analysis and financial markets.

    Through Naranj Capital, Arijit shares his market insights and research analysis, offering actionable advice for investors. His work is featured on platforms like TradingView, where he publishes detailed analysis and recommendations.

    If you’re interested in learning more about Arijit’s work or Naranj Capital’s services, you can reach out to them directly through their website