
Buy Al-Omran Industrial Trading | Tadawul 4141 | 10-12% gain | Saudi stock trading picks on 29 Jan 2024

Stock Market

Tadawul, Saudi Arabia

Target hit. Trade closed.

ALOMRAN 4141

29 Jan 2024
18 Mar 2024
18 Mar 2024
34 days
Loss per
100,000 SAR
Stop-loss
42
Buy Advice
29 Jan 2024
43.5 – 44.5
Target 1
18 Mar 2024
48
Target 2
18 Mar 2024
48.5
Profit per
100,000 SAR
34 days
11,494
42
43.5 – 44.5
48
48.5
11,494
29 Jan 2024
18 Mar 2024
18 Mar 2024
34 days
Loss per
100,000 SAR
Stop-loss
42
Buy Advice
29 Jan 2024
43.5 – 44.5
Target 1
18 Mar 2024
48
Target 2
18 Mar 2024
48.5
Profit per
100,000 SAR
34 days
11,494
42
43.5 – 44.5
48
48.5
11,494
  • Buy
  • Buy
    Range
  • Target
  • Stoploss
  • Upside
    Potential
  • Trade
    Duration
  • Al-Omran Industrial Trading
  • 43.5 – 44.5
  • 48 – 48.5
  • Below 42
  • 10% - 11%
  • 15 - 16 Days
  • Buy Al-Omran Industrial Trading
  • Buy
    Range
    43.5 – 44.5
  • Target 48 – 48.5
  • Stoploss Below 42
  • Upside
    Potential
    10% - 11%
  • Trade
    Duration
    15 - 16 Days
  • * Once the first target hit, reset the StopLoss at your buying price.
    * Trade durations are approximate; actual holding period may vary.

    Tadawul 4141 : Al-Omran Industrial Trading - Stock Overview

  • Tadawul code
  • Stock Name
  • Sector
  • 52 Weeks High
  • 52 Weeks Low
  • 4141
  • Alomran
  • Capital Goods
  • 49.91
  • 31
  • Tadawul code 4141
  • Stock Name Alomran
  • Sector Capital Goods
  • 52 Weeks High 49.91
  • 52 Weeks Low 31
  • Company profile

    Al Omran industrial and treading is a Saudi based company. It produces electrical appliances for the house, plastic, paper and cartons, wholesale and retail electrical products, purchasing and renting land. The company engages in the manufacture of a range of products like Storage and Warehouse Systems, Coolers, Coolers Flask, Washers Ordinary Basin, Air Conditioner Aspelet Unix and many more things.

  • Tadawul 4141 : Al-Omran Industrial Trading - Technical Analysis (Daily)

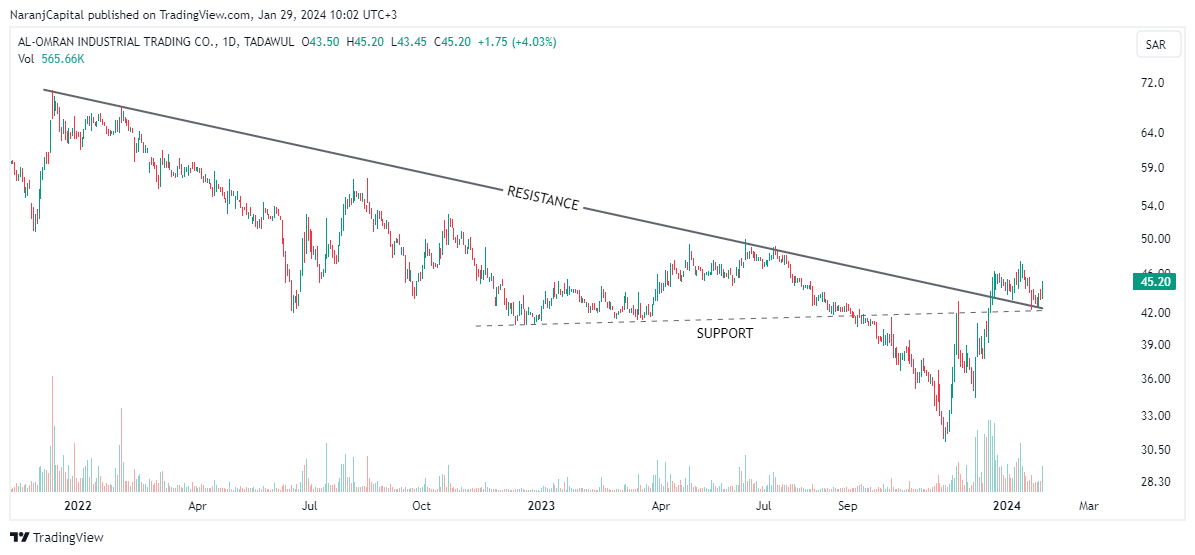
    Al-Omran Industrial Trading - Technical Analysis chart on Daily Price and Volume
    Al-Omran Industrial Trading - Technical Analysis chart on Daily Price and Volume

    • The stock had been maintaining a trendline resistance. But in Jan’24, this stock breaks its resistance level and sustaining above the previous resistance level.
    • The trading volume has been drastically changed in last few days, which indicates bulls are going to dominate bears and uplift the price range.
  • Tadawul 4141 : Al-Omran Industrial Trading - Fibonacci Retracement

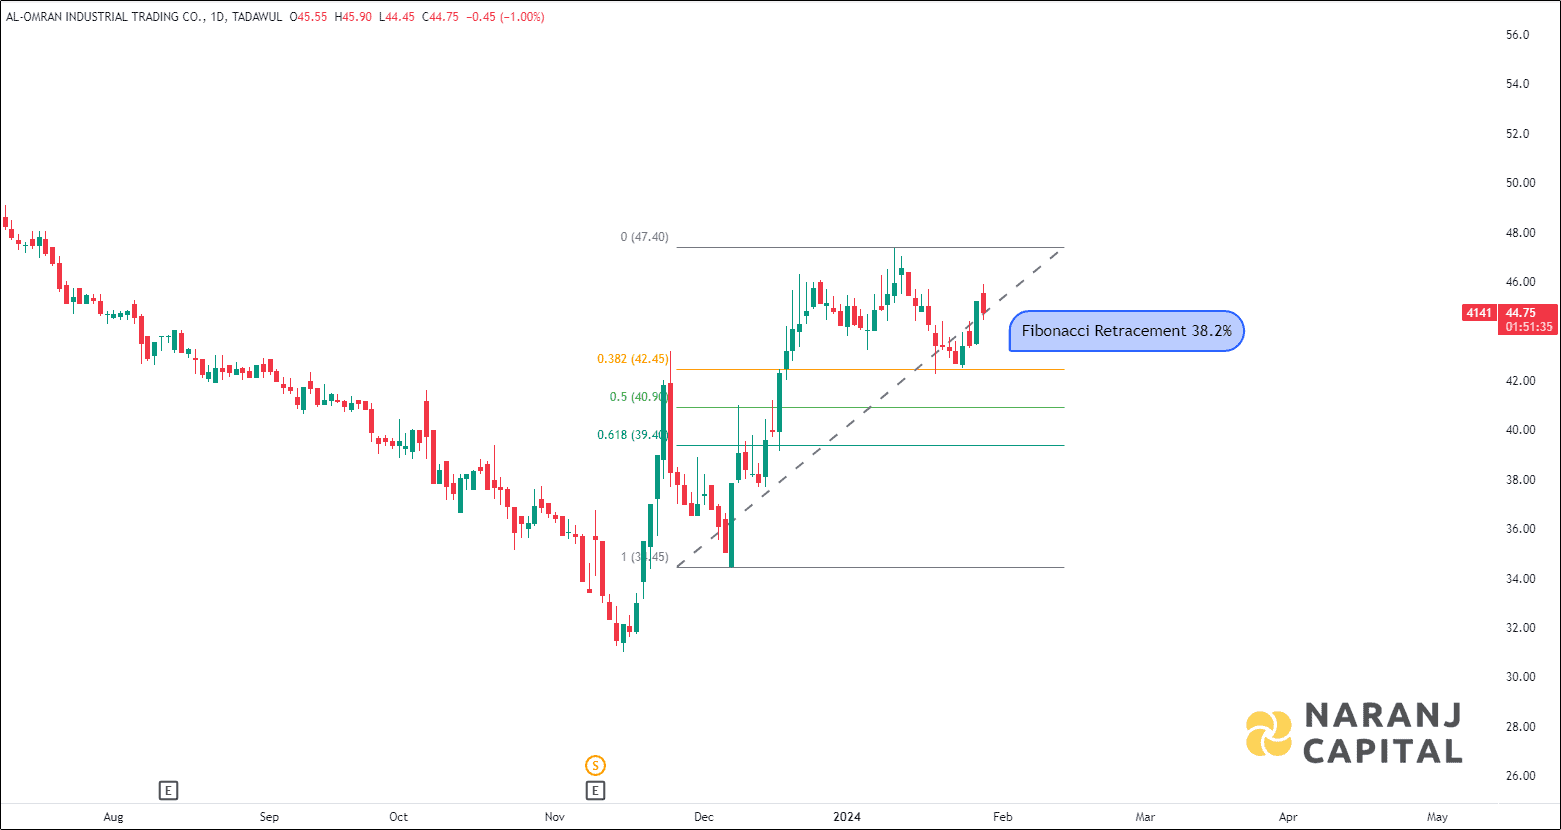
    Al-Omran Industrial Trading stock analysis based on Fibonacci Retracement
    Al-Omran Industrial Trading - Fibonacci Retracement

    • The stock price took support exactly at the 38.2% Fibonacci retracement level and sustaining over it. It seems that the price will move upside.
    • If the stock somehow manages to break nearest resistance level at 48, then more upside move possible in upcoming days.
  • Conclusion - Tadawul 4141 : Al-Omran Industrial Trading Stock Price Forecast

    Based on our trading tips for Saudi Tadawl stocks, Al-Omran Industrial Trading stock price target will be SAR 48 - SAR 48.5 in the next 15-16 trading sessions.

  • MONEY MANAGEMENT AND TRADING RULES

    ●   Buy within the recommended price range.

    ●   No need to rush. The recommendation remains valid for up to 7 days, not just at the market open.

    ●   Always respect the stop-loss. It defines your risk on the trade.

    ●   Once the trade moves in your favour, use a trailing stop-loss to protect and lock in profits.

    ●   Spread your trading capital across our other recommended stocks instead of putting it all into one trade.

    ●   Invest responsibly. Your ideal position size should be based on the downside risk of this trade, not the potential upside. Before entering, assess how much loss you can comfortably and financially absorb if it goes against you, and set your position size accordingly. Hedge positions where appropriate.

    ANALYST SUMMARY

    This research is prepared by the Naranj Capital research team under the guidance of Arijit Banerjee, CMT, CFTe, Founder and Director of Naranj Capital. Stock selection and all trade levels, including the buy range, targets and stop-loss, are personally finalised by him.

    Arijit is a veteran trader and active investor with over 16 years of experience across global markets. He has in-depth expertise in financial market research, advanced technical analysis, market cycles, algorithmic trading and portfolio management. He is a Chartered Market Technician (CMT), accredited by the CMT Association, USA, the leading global authority on technical analysis. He also holds the Certified Financial Technician (CFTe) designation from the International Federation of Technical Analysts (IFTA).

    The views expressed herein are based on publicly available information, internal research and other sources believed to be reliable, but not necessarily all-inclusive and not guaranteed as to accuracy. The recommendations provided herein are solely for informational purposes and are not intended to be and must not be taken alone as the basis for an investment/trading decision. Trading and investing are subject to market risk and the securities discussed and opinions expressed herein may not be suitable for all investors. Past performance is not indicative of future results. To read the full disclosure, please click here.

    Share with
    0 0 votes
    Article Rating
    Subscribe
    Notify of
    guest
    0 Comments

    Join Our Telegram Channel for Saudi Stock Market Update

    Join Naranj Capital on Telegram for free stock alerts

    Saudi Stock Analysis

    Join Our Telegram Channel for USA Stock Analysis Update

    Join Naranj Capital on Telegram for free stock alerts