Introduction
Every day on financial news channels, two numbers come up more than anything else.
The Dow is up 300 points. The S&P 500 gained 1.2 percent. Markets closed higher today.
Most people nod along. But very few actually know what those two numbers mean, how they are calculated, or why they sometimes move in different directions on the same day.
Here is the simple explanation.
Whether you are a long-term investor or someone interested in swing short term trading in USA stocks, understanding the difference between the Dow and the S&P 500 can help you better interpret daily market moves. Many traders rely on these indexes to gauge overall market sentiment before making investment decisions.
What is a stock market index?
Before comparing the two, let us understand what an index actually is.
An index is just a list of selected stocks combined into one single number that tells you how that group is performing overall. Think of it like a report card for a section of the stock market.
When someone says the market went up today, they usually mean one of these two indexes moved higher. The index number itself is not a price or a dollar amount. It is just a calculated score that goes up when the stocks in that list do well and goes down when they fall.
What is the Dow Jones?
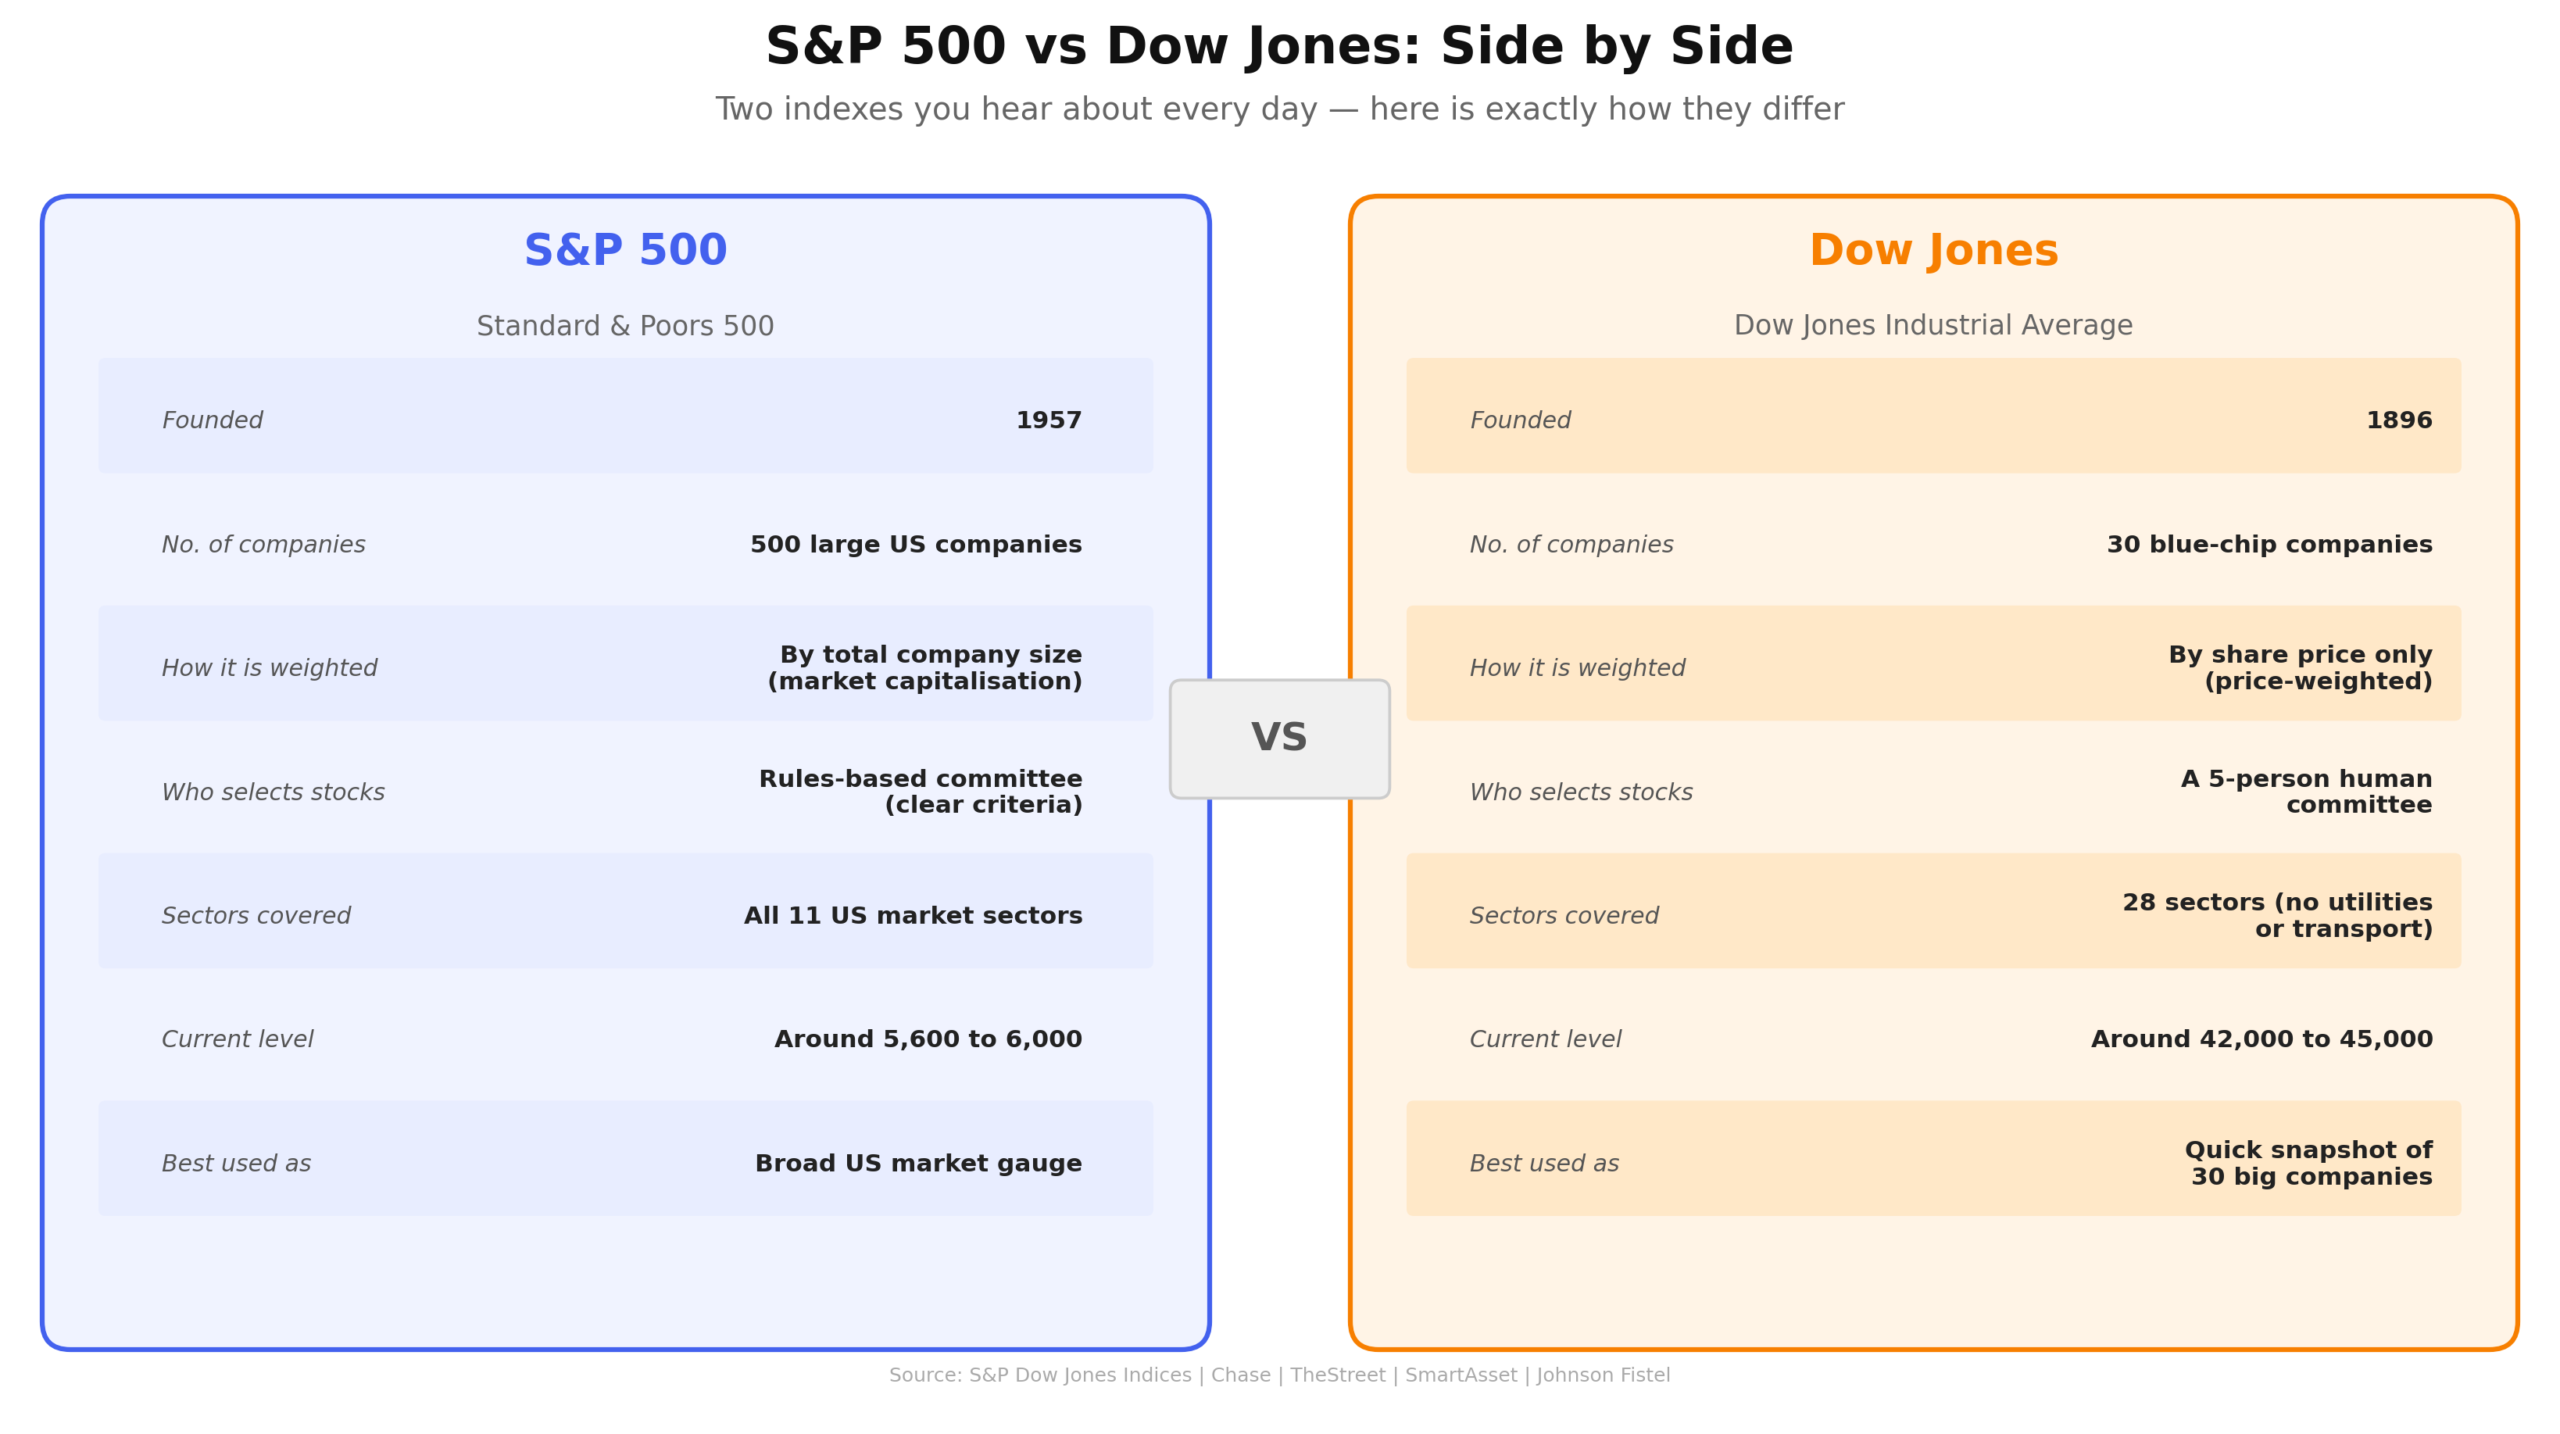
The Dow Jones Industrial Average, usually just called the Dow, is the oldest major stock index in America. It was created in 1896 by Charles Dow and Edward Jones and originally tracked just 12 industrial companies. Today it tracks 30 companies.
That number is worth pausing on. Thirty companies. Out of the thousands listed on American stock exchanges, the Dow picks just 30 and uses those to represent the entire market.
The companies inside it are household names. Apple, Coca-Cola, McDonald's, Johnson and Johnson, Goldman Sachs, and Nike among others. They are selected by a five-person committee made up of representatives from S&P Global and The Wall Street Journal. The committee chooses based on reputation, history of growth, and how well the company represents the broader American economy.
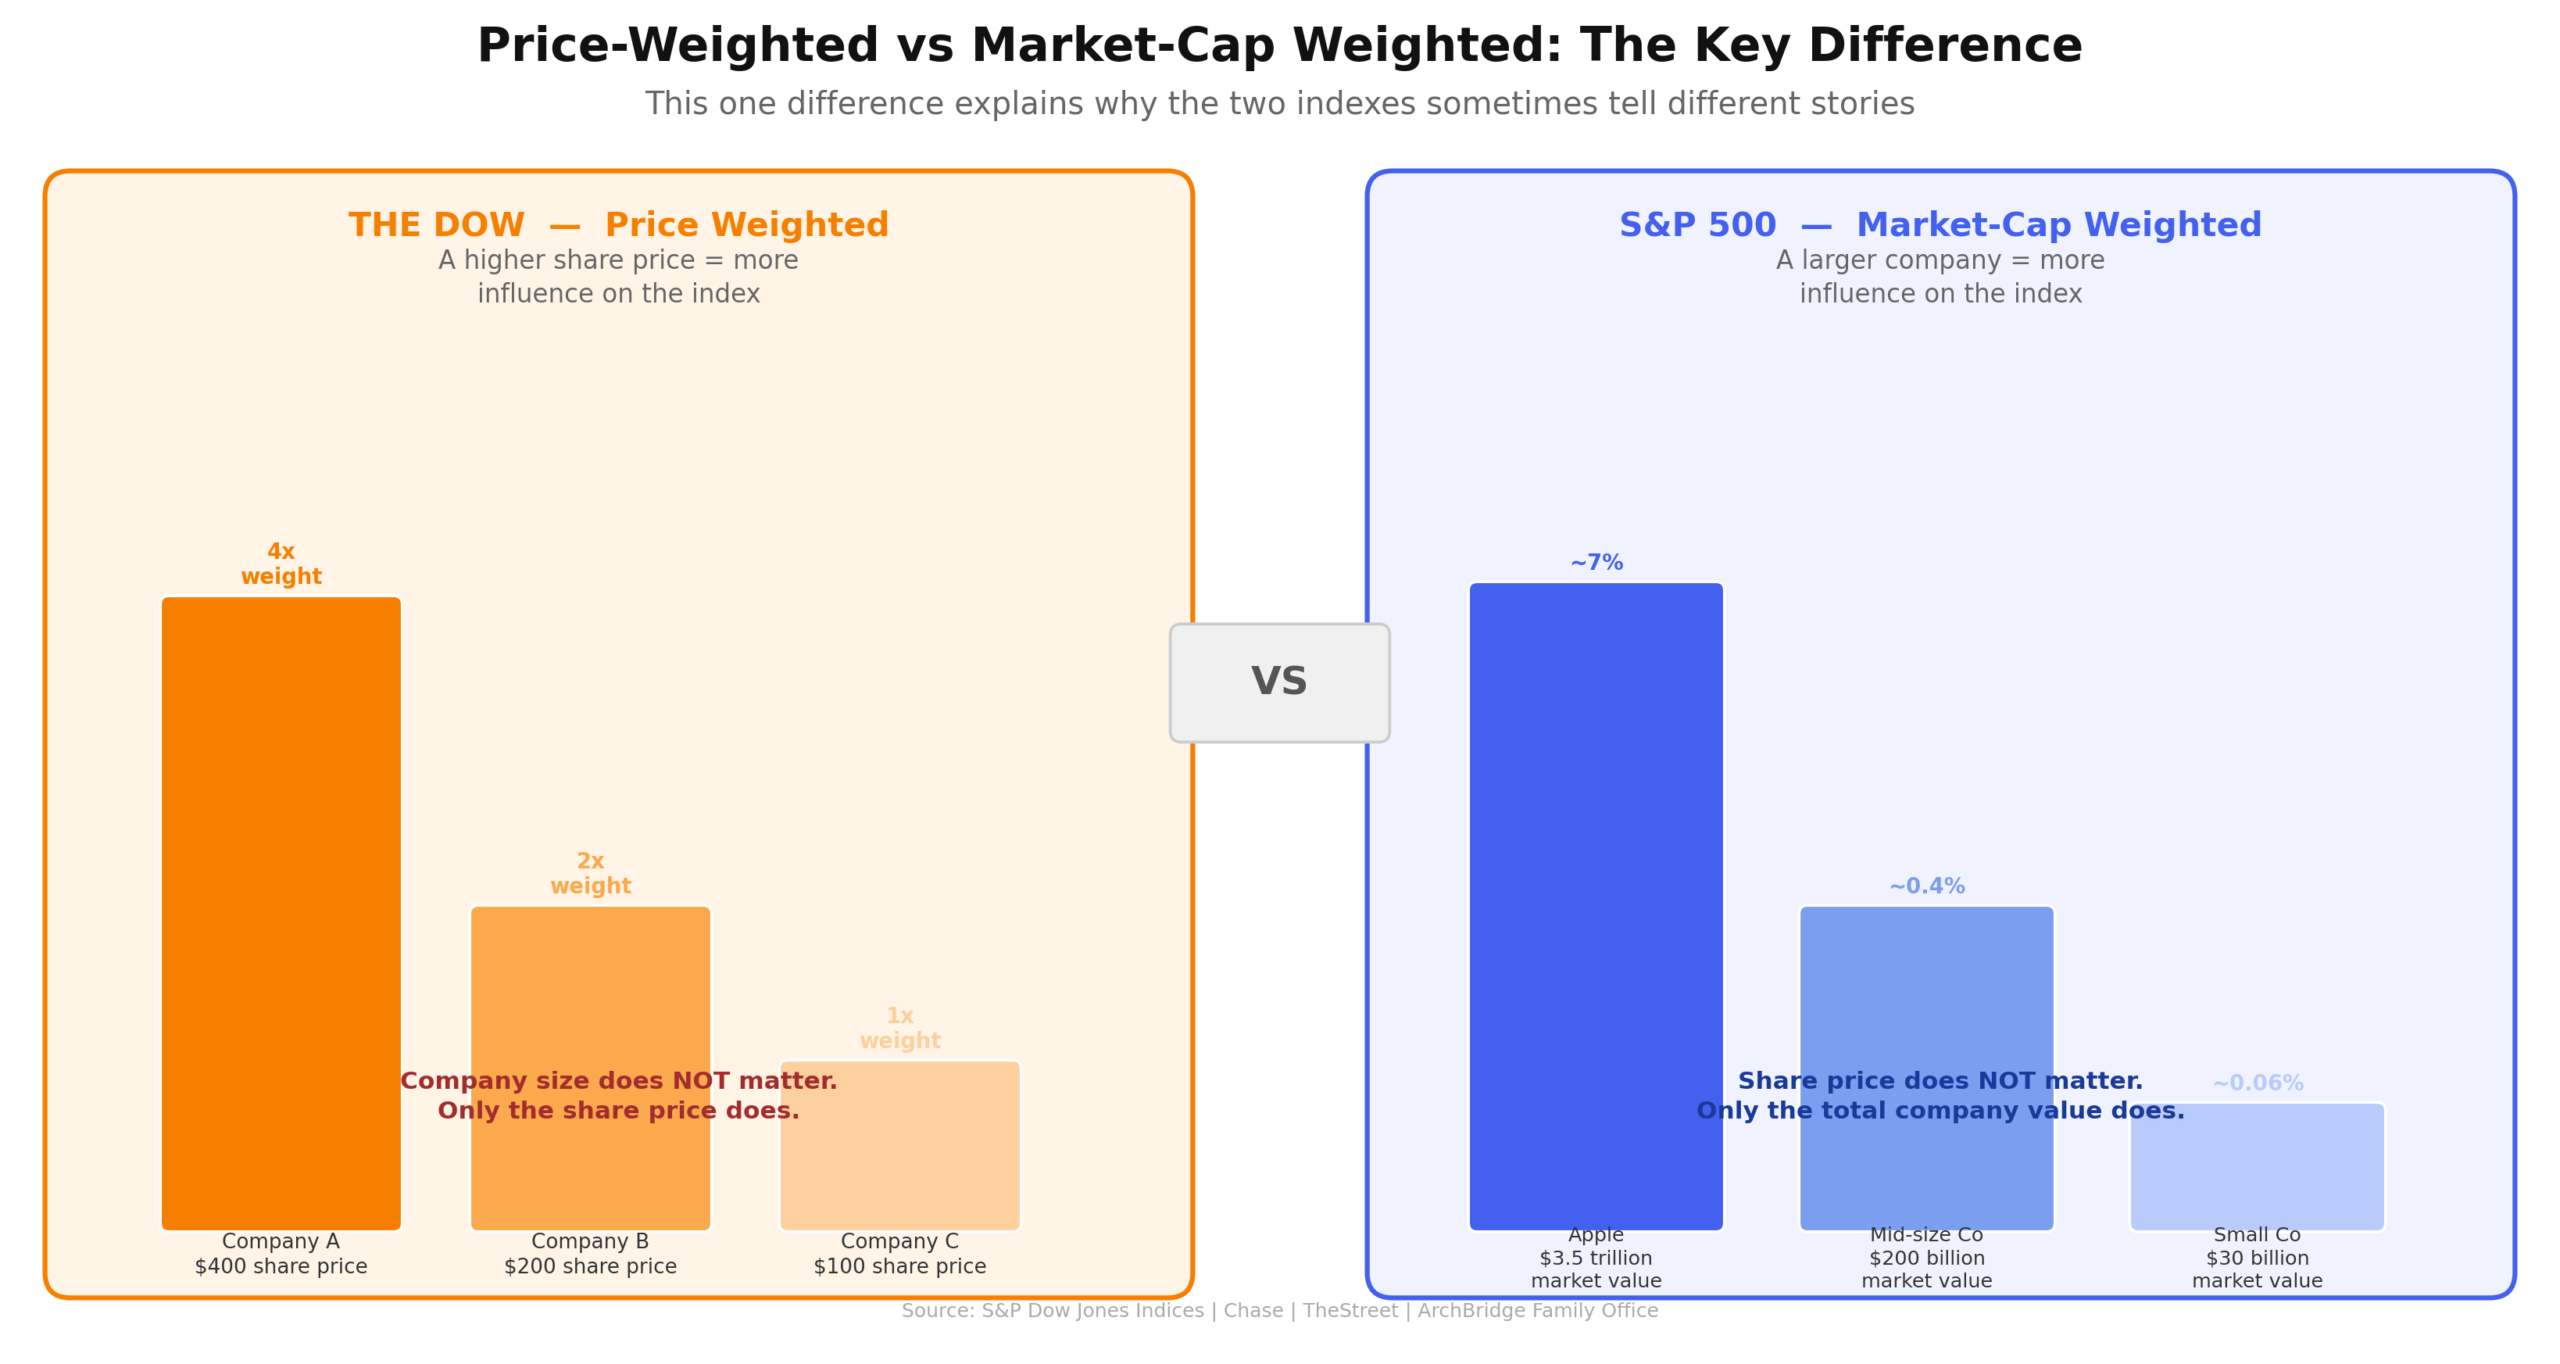
Now here is the unusual part. The Dow is price-weighted. This means a company with a higher share price has more impact on how the index moves, even if that company is not actually the largest business.
What does that mean in plain language? Imagine two companies in the Dow. Company A has a share price of $400. Company B has a share price of $100. Even if Company B is actually a much bigger business in total value, Company A moves the Dow four times more than Company B does. Simply because its share price is higher.
This is strange when you think about it. A company's share price depends partly on how many shares it has issued, not just on how big the company actually is. Two equally sized businesses could have very different share prices just because one split its stock more times.
What is the S&P 500?
The S&P 500 tracks 500 of the largest US companies across various sectors. It was created in 1957 and is widely regarded as the best gauge of large-cap US equities.
Five hundred companies versus thirty. That is the first and most obvious difference.
But how those companies are weighted matters even more.
The S&P 500 is market-cap weighted. Market cap simply means the total value of a company. You calculate it by multiplying the share price by the total number of shares. A company worth two trillion dollars carries far more weight in the S&P 500 than a company worth fifty billion dollars.
This makes more logical sense. The bigger the company, the more it matters to the overall economy, so the more it moves the index. Apple, Microsoft, and Amazon together represent roughly one-fifth of the entire S&P 500's value.
To be included in the S&P 500, a company must meet strict criteria including a market capitalisation of at least $22.7 billion, positive earnings over the most recent four quarters, and sufficient trading liquidity. The selection follows clear rules rather than a committee's personal judgment.
The clearest way to see the difference
Here is a real example that makes the whole thing click.
Imagine a company in the Dow has a share price of $350. That makes it one of the most influential stocks in the Dow purely because of its high share price.
Now imagine that company does a 10-for-1 stock split. Its share price drops from $350 to $35. The company's total value has not changed at all. Same business, same profits, same employees. But its impact on the Dow shrinks dramatically overnight simply because its price tag is now lower.
The S&P 500 would not care about this split at all. The total company value stays the same, so its weight in the S&P 500 stays the same.
The Dow gets confused by the price change. The S&P 500 does not. This is why most professional investors and economists consider the S&P 500 to be a more accurate picture of the American stock market.
How their sector weights differ
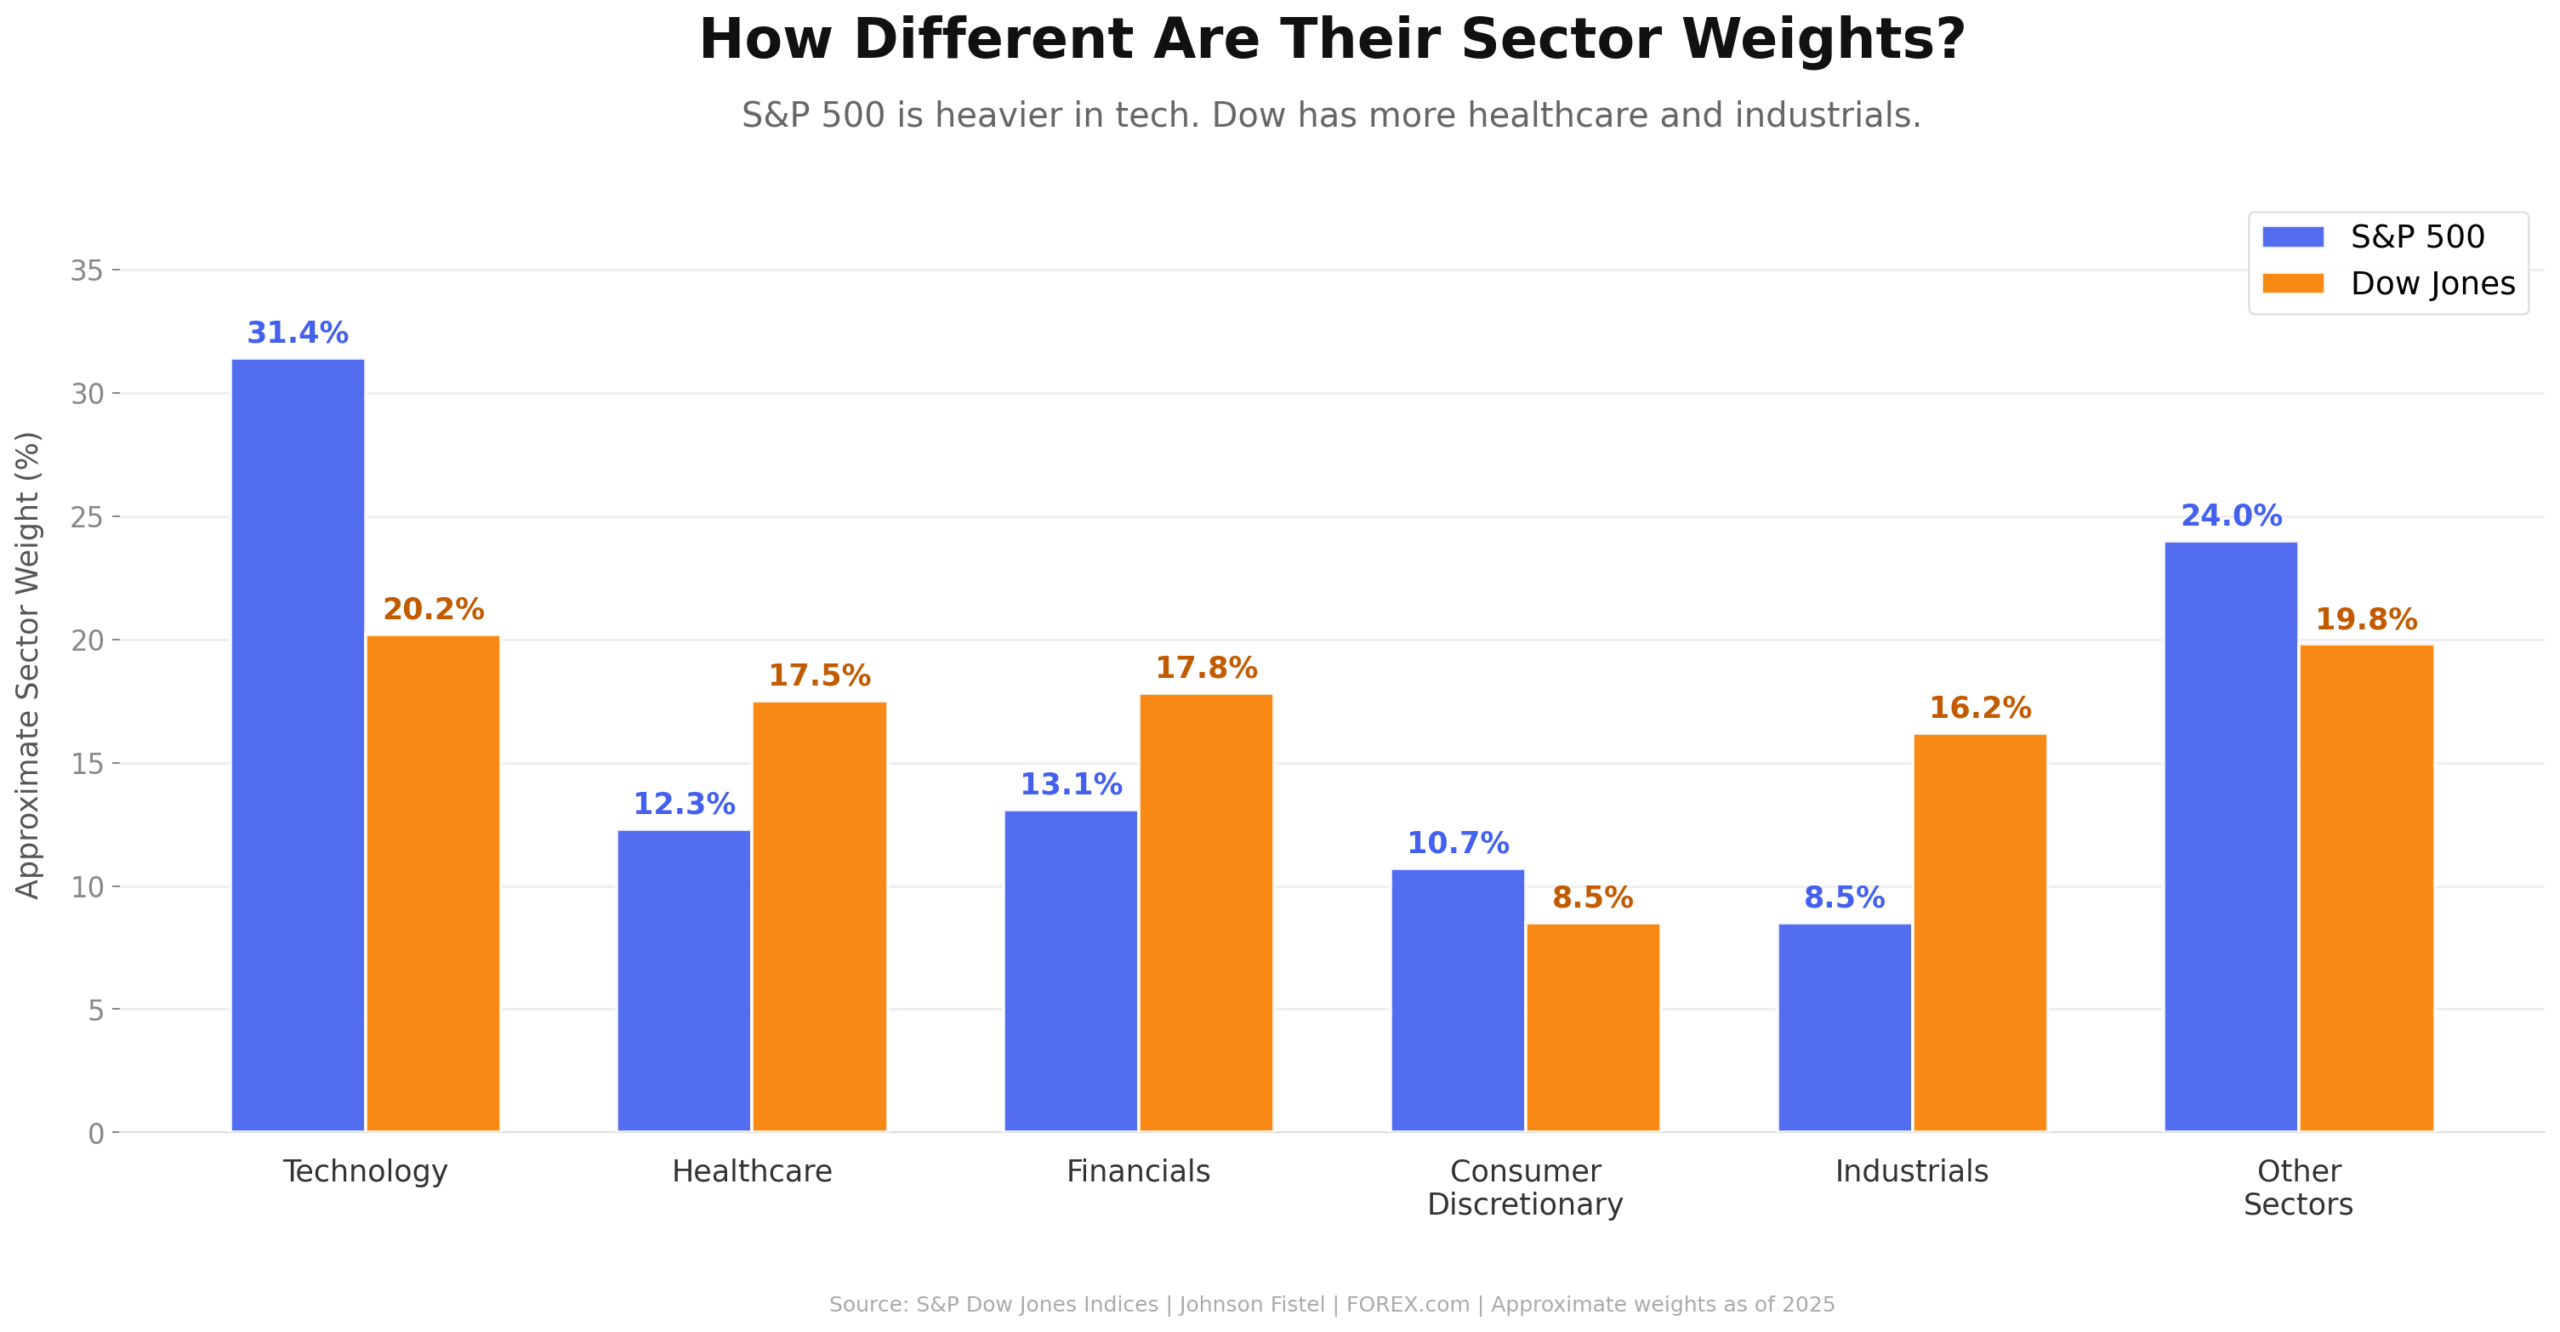
Because the S&P 500 includes 500 companies weighted by total value, technology giants like Apple, Microsoft, and Nvidia carry enormous weight. Technology makes up roughly 31 percent of the entire S&P 500.
The Dow, with only 30 stocks and a price-weighted system, has a heavier lean toward healthcare and industrials. It also completely excludes utilities and transportation companies, which are tracked in separate Dow Jones indexes.
This means when technology stocks are flying, the S&P 500 tends to rise faster than the Dow. When industrial and healthcare stocks lead, the Dow can outperform. Same market, two different stories depending on which sectors are winning on any given day.
Why do people still talk about the Dow so much?
Simple answer. It is old and familiar.
Once upon a time, the Dow was the default benchmark investors used to judge the market. That is no longer true. Since the S&P 500 was introduced, it has steadily taken over as the more trusted benchmark, especially after Vanguard and others launched S&P 500 index funds and ETFs that millions of Americans now use in their retirement plans.
But the Dow has 130 years of history. It has survived two world wars, the Great Depression, the 2008 financial crisis, and every market crash in between. News channels have quoted it for generations. People trust what they recognise.
Thirty big companies. One number. Easy to understand in a headline. That is why the Dow stays in the news even though most professionals have moved on to the S&P 500 as their preferred yardstick.
Which one should you actually pay attention to?
If you want a quick snapshot of how a handful of America's most established companies are doing on any given day, the Dow works fine.
If you want to understand what is actually happening across the broader American economy and stock market, the S&P 500 is the better signal. It covers all 11 recognised market sectors and represents roughly 80 percent of the total US stock market value.
The S&P 500 has generally outperformed the Dow over longer periods, largely because it captures fast-growing technology companies at their proper full weight, something the price-weighted Dow does not do as cleanly.
For most investors putting money into index funds for retirement or long-term savings, the S&P 500 is the more commonly used and more trusted benchmark.
Even professional investors and trading advisory services for US stocks use the S&P 500 as their primary benchmark because it provides a broader and more accurate picture of the US equity market. While the Dow remains an iconic index, understanding both can help investors make more informed decisions instead of reacting to headlines alone.
One last thought
The Dow and the S&P 500 usually move in the same direction on most days. When markets are happy, both go up. When markets are scared, both fall.
But they are built differently, cover very different numbers of companies, and weight those companies in completely different ways.
Understanding that difference does not just make you sound smarter. It helps you understand exactly what that number flashing across your screen is actually telling you about the world.