Introduction
In 1952, a 25-year-old graduate student wrote a paper that would eventually win a Nobel Prize. That paper changed how nearly every professional investor in America builds a portfolio today. It's called Modern Portfolio Theory, and despite the intimidating name, the core idea is something you can understand in five minutes.
For investors exploring US trading and investment advice, understanding Modern Portfolio Theory can be useful because it provides a framework for thinking about risk, diversification, and how different investments work together.
What Is Modern Portfolio Theory, Really?
Modern Portfolio Theory, often shortened to MPT, is a framework for building an investment portfolio that gets you the highest possible return for the amount of risk you're willing to take. It was developed by economist Harry Markowitz in 1952.
Before Markowitz, most investors picked stocks one at a time, judging each one purely on its own merits. His big insight was simple but powerful: what matters isn't just how good each individual investment looks on its own. What matters is how all your investments behave together.
Think of it like building a sports team. You don't just recruit the five best individual players you can find. You build a team where the players' skills complement each other. A portfolio works the same way. The goal isn't just picking great assets one by one. It's combining them so they work well as a group.
The Big Idea: Diversification Done Right
Most people know diversification means not putting all your eggs in one basket. MPT takes that idea further. It's not enough to just own many different stocks. What matters is how those stocks move in relation to each other.
If you own ten stocks that all rise and fall together, you're not really diversified. You just own one big bet spread across ten tickers. Real diversification means combining assets that don't move in exact lockstep, so when one zigs, another might zag, smoothing out your overall ride.
Risk and Return: The Trade-off
Generally, taking on more risk gives you the potential for higher returns, while playing it safer usually means accepting lower expected returns. MPT doesn't try to eliminate this trade-off. Instead, it helps you get the best possible return for whatever level of risk you're comfortable carrying.
The Efficient Frontier
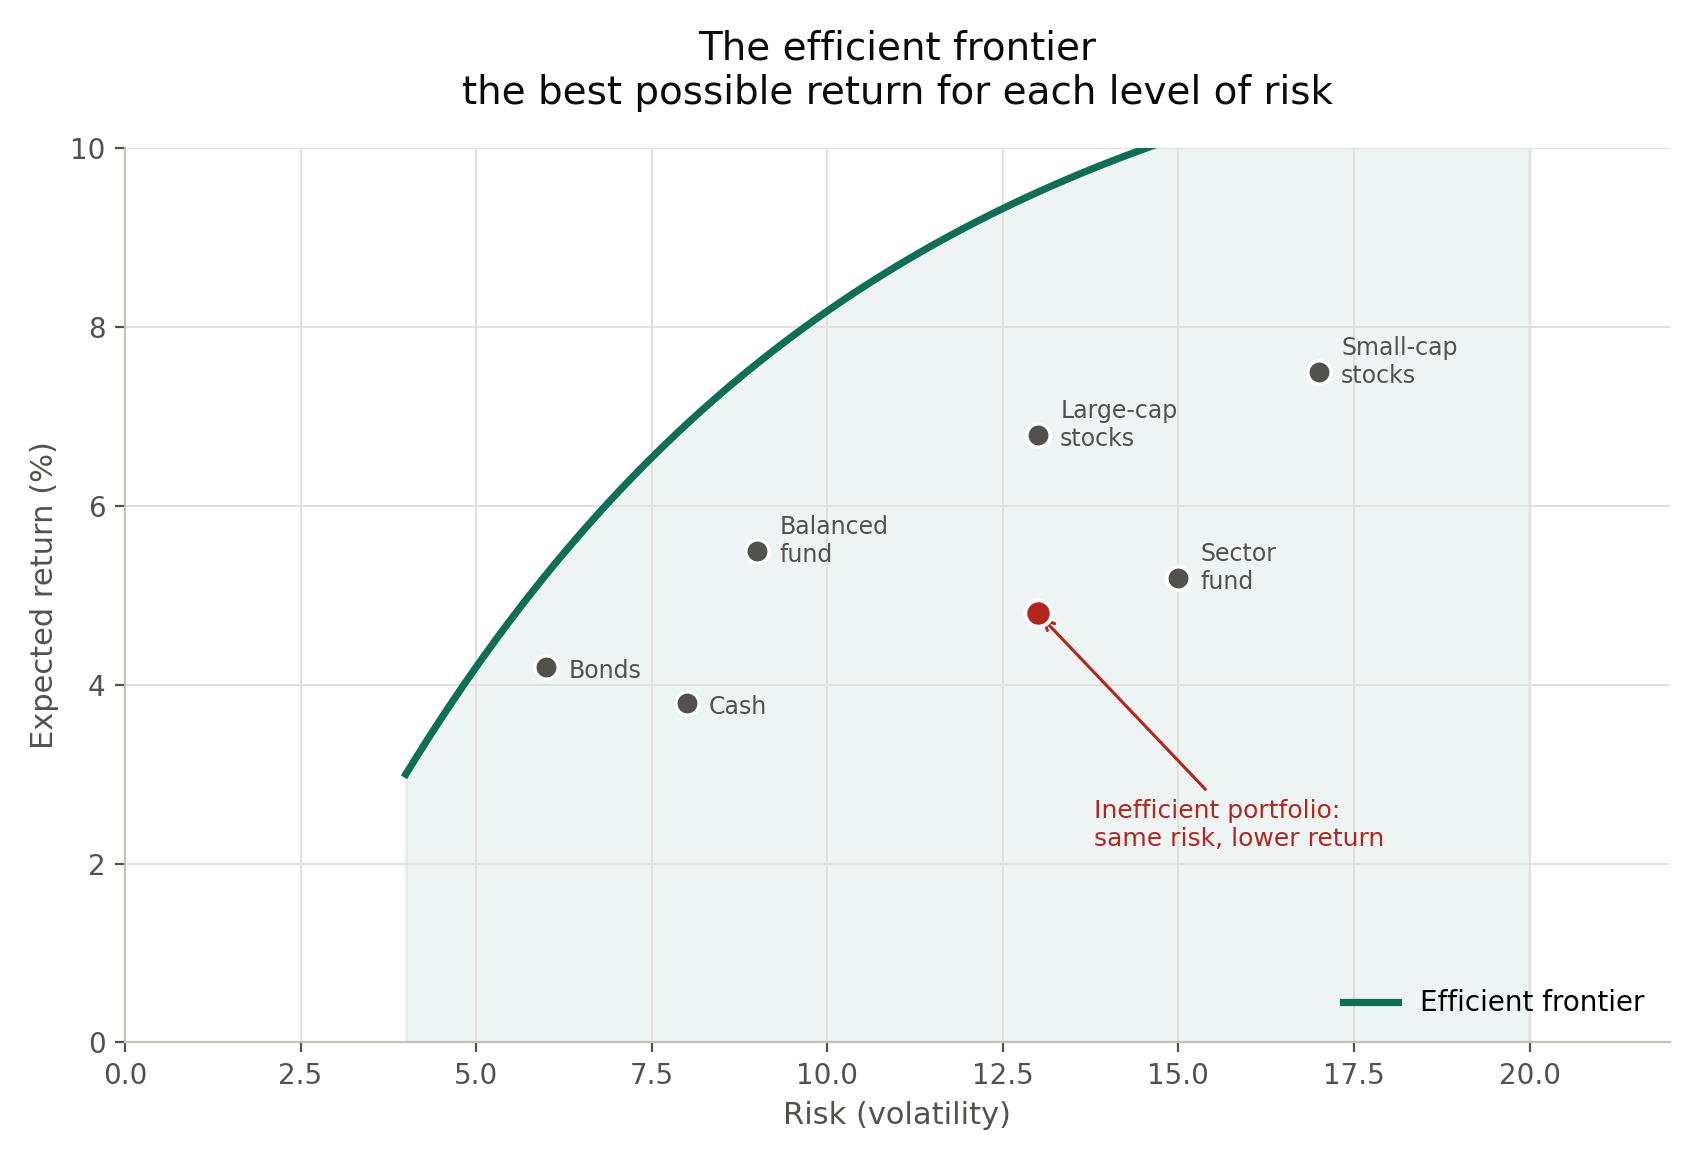
MPT introduces something called the efficient frontier. Picture a chart with risk along the bottom and expected return going up the side. If you plotted every possible portfolio you could build, most of them would be "inefficient," meaning you could get a better return for the same risk, or the same return for less risk, simply by mixing your assets differently.
The efficient frontier is the curve connecting all the best possible portfolios, the ones that squeeze out the maximum return for each level of risk. Any portfolio sitting below that curve is quietly leaving performance on the table.
Two Kinds of Risk
MPT also draws a useful line between two types of risk.
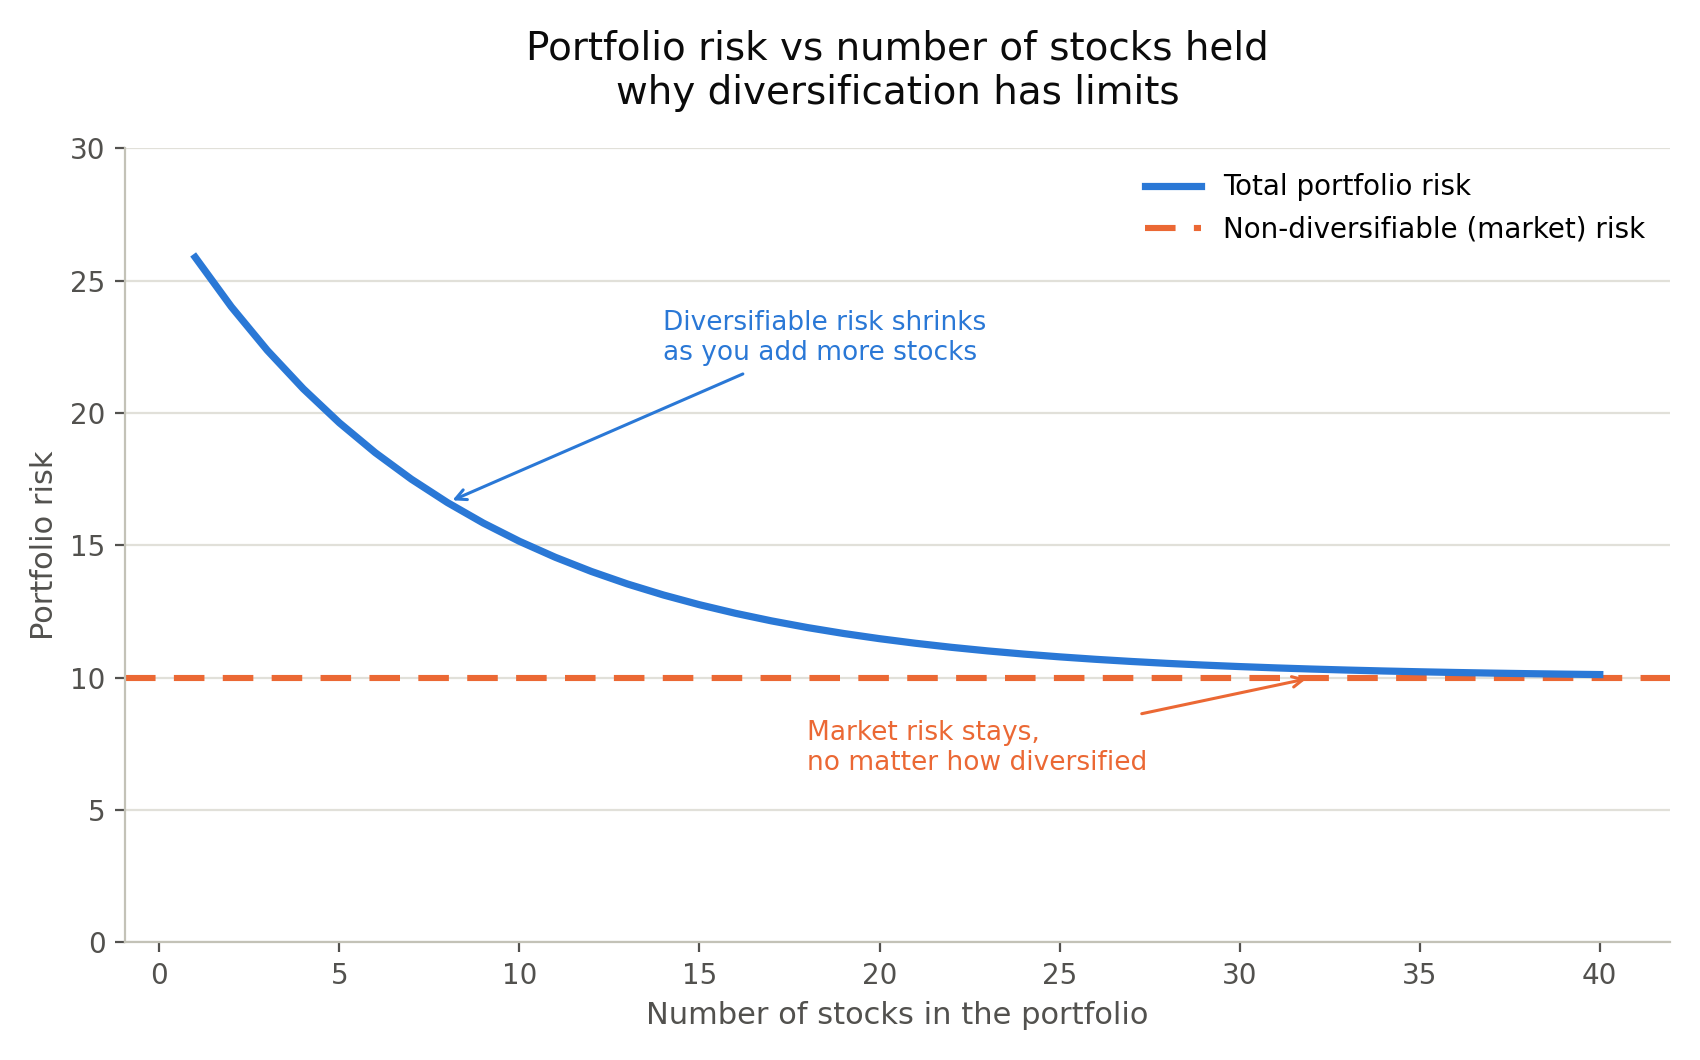
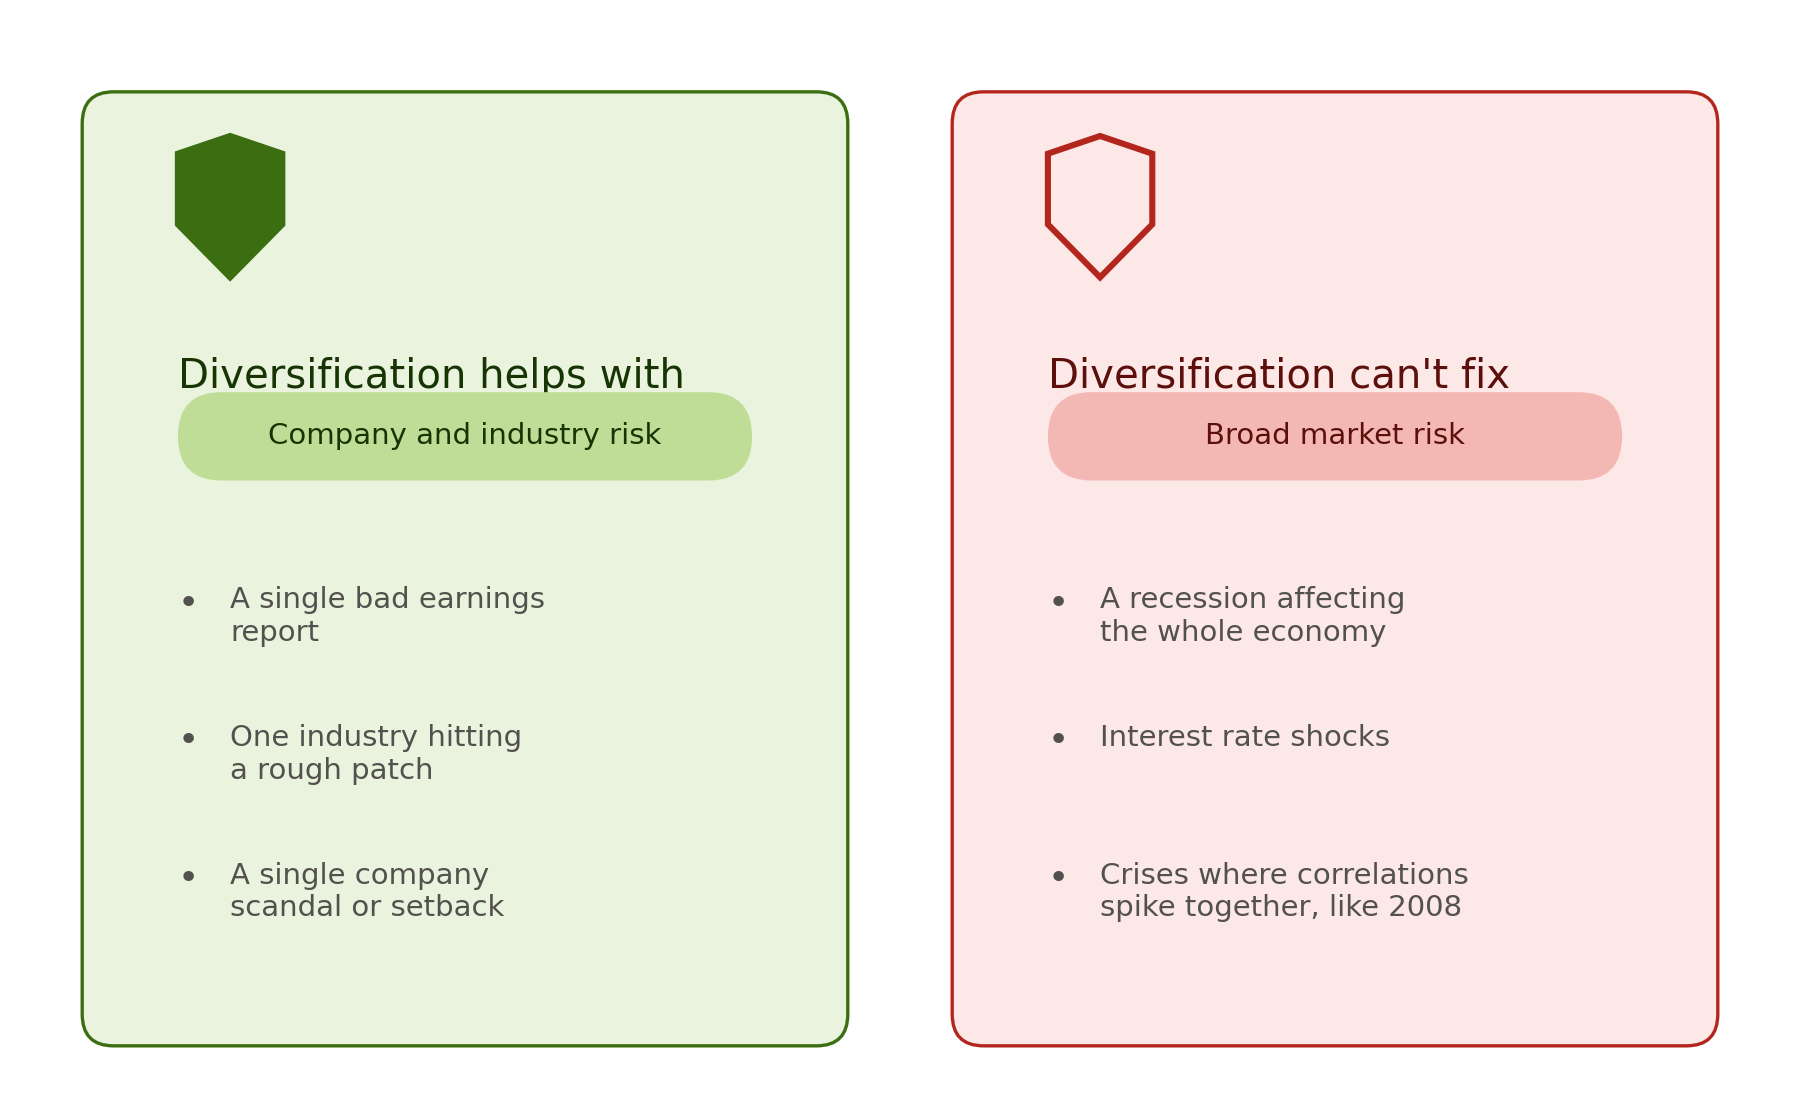
Diversifiable risk, sometimes called unsystematic risk, is risk specific to one company or industry, like a bad earnings report or a factory shutdown. If you only own one airline stock and that airline has a rough quarter, your whole portfolio feels it. Spread your money across airlines, banks, healthcare, and tech, and one company's bad quarter barely registers. You can reduce this kind of risk simply by owning a wide variety of investments.
Non-diversifiable risk, sometimes called systematic or market risk, comes from broad economic forces: recessions, interest rate changes, inflation. When the Federal Reserve raises rates or the economy tips into a downturn, nearly every stock feels some effect, no matter how well diversified your portfolio is. No amount of diversification can fully remove this kind of risk, because it affects nearly everything at once.
Two Portfolios, Two Different Rides
Let's imagine two investors, both starting with the same amount of money.
Maria puts everything into five stocks, all in the same industry, convinced this sector is about to take off. Her portfolio can swing wildly, since all five stocks tend to rise and fall together.
David spreads his money across stocks, bonds, and a few other asset types that don't move in lockstep with each other. When one part of his portfolio dips, another often holds steady or even rises, keeping his overall swings much smaller.
Both investors might end up with similar long-term returns. But David's ride is far smoother, and smoother rides are easier to stick with, especially when markets get scary.
| Factor | Maria (Concentrated) | David (Diversified) |
|---|---|---|
| Holdings | Five stocks, one industry | Stocks, bonds, multiple sectors |
| How they move | Mostly together | Not in lockstep |
| Portfolio swings | Large and sudden | Smaller and steadier |
| Hardest part | Staying calm during a sector-wide drop | Resisting the urge to chase whatever is hottest |
What MPT Gave Us
MPT's fingerprints are all over how Americans invest today.
- Index funds and target-date retirement funds are built directly on MPT's diversification principles, spreading your money across hundreds or thousands of holdings instead of a handful of individual picks.
- The classic "60/40 portfolio," 60% stocks and 40% bonds, is a simplified attempt at finding a comfortable spot on the efficient frontier, trading some potential upside for a smoother ride.
- Robo-advisors use MPT-based algorithms to automatically build diversified portfolios for millions of everyday investors, adjusting the mix based on how much risk someone says they're willing to take.
- Financial advisors routinely use MPT concepts, like risk tolerance and asset allocation, as the starting point for nearly every retirement conversation.
The Limits of Modern Portfolio Theory
MPT isn't perfect, and it's worth understanding its blind spots.
- It relies on historical data to estimate future risk and return, but the future doesn't always look like the past. A stock that seemed stable for a decade can suddenly become volatile.
- It assumes investors behave rationally, which doesn't always hold up in the real world of fear and greed. Plenty of people abandon a sound long-term plan the moment markets get scary.
- During real crises, like 2008, assets that normally don't move together can suddenly become highly correlated, exactly when investors need diversification the most. Stocks, real estate, and even some bonds fell together that year, catching a lot of well-diversified portfolios off guard.
Practical Takeaways
- Think about your whole portfolio, not just individual picks. Ask how a new investment fits with what you already own.
- Real diversification means combining assets that behave differently, not just owning a lot of similar things.
- Match your portfolio's risk level to something you can actually stick with, especially during downturns.
- Remember that MPT is a useful map, not a perfect prediction of the future.
- When evaluating individual US-listed stocks, USA stock trading advice should consider more than just the potential upside. Portfolio exposure, sector concentration, volatility, and how the stock interacts with existing holdings can all matter.
Conclusion
Before Markowitz, investing often felt like judging ingredients one at a time. Modern Portfolio Theory taught investors to think like chefs instead, asking not just whether each ingredient is good on its own, but how the whole dish comes together.
Seventy years later, that shift in thinking still shapes nearly every retirement account, index fund, and robo-advisor in America. Understanding it won't guarantee you the best returns, but it will help you build a portfolio that's genuinely built to handle whatever the market throws at it.