Introduction
Every four years, the stock market goes through something investors call the "midterm year." History says these years tend to be bumpy. It also says something surprising happens right after. Let's walk through what usually happens, and how 2026 is actually shaping up.
For investors using trading advisory services for US stocks, the midterm cycle is worth understanding because elections can add another layer of uncertainty to an already complex market. But history also shows that election headlines are only one of many factors that can influence stock prices.
What Usually Happens to Stocks in a Midterm Year
A midterm year is the second year of a president's term, when all of the House and part of the Senate are up for election. No presidential race, just Congress.
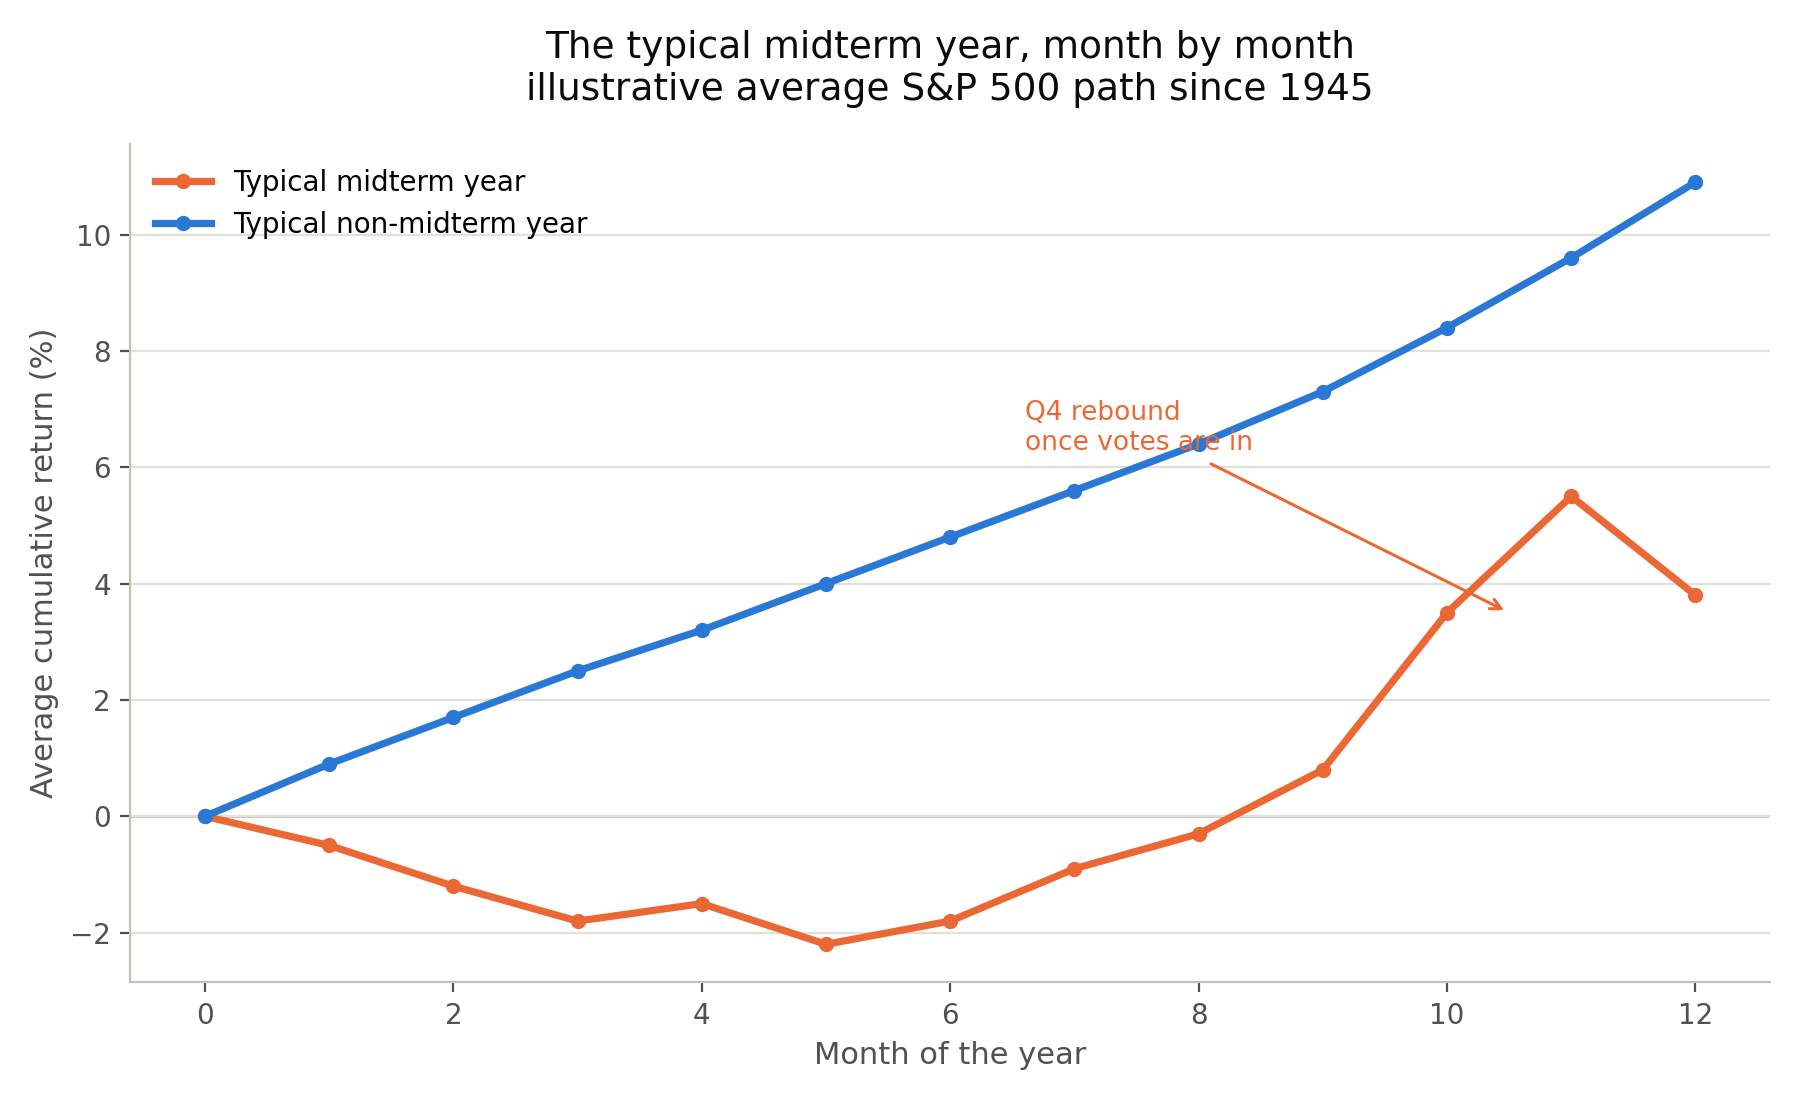
Going back to 1945, the S&P 500 has historically gained about 3.8% on average during midterm years. Compare that to an average gain of nearly 11% in the other three years of the four-year presidential cycle. Midterm years are also choppier. The average pullback from a high point to a low point during a midterm year has been around 18-19%, notably deeper than in other years.
Put simply: midterm years tend to be slower and shakier than usual, on average. That said, averages can be misleading. Performance has also varied a lot by sector and by the specific economic conditions of each cycle, so no two midterm years have played out identically.
The Bumpy Front, the Calm Back
Here's where it gets interesting. That weakness isn't spread evenly across the year.
The first three quarters of a midterm year have historically been roughly flat, even slightly negative on average. But the fourth quarter, once Election Day has come and gone, has historically bounced back with an average gain of over 6%.
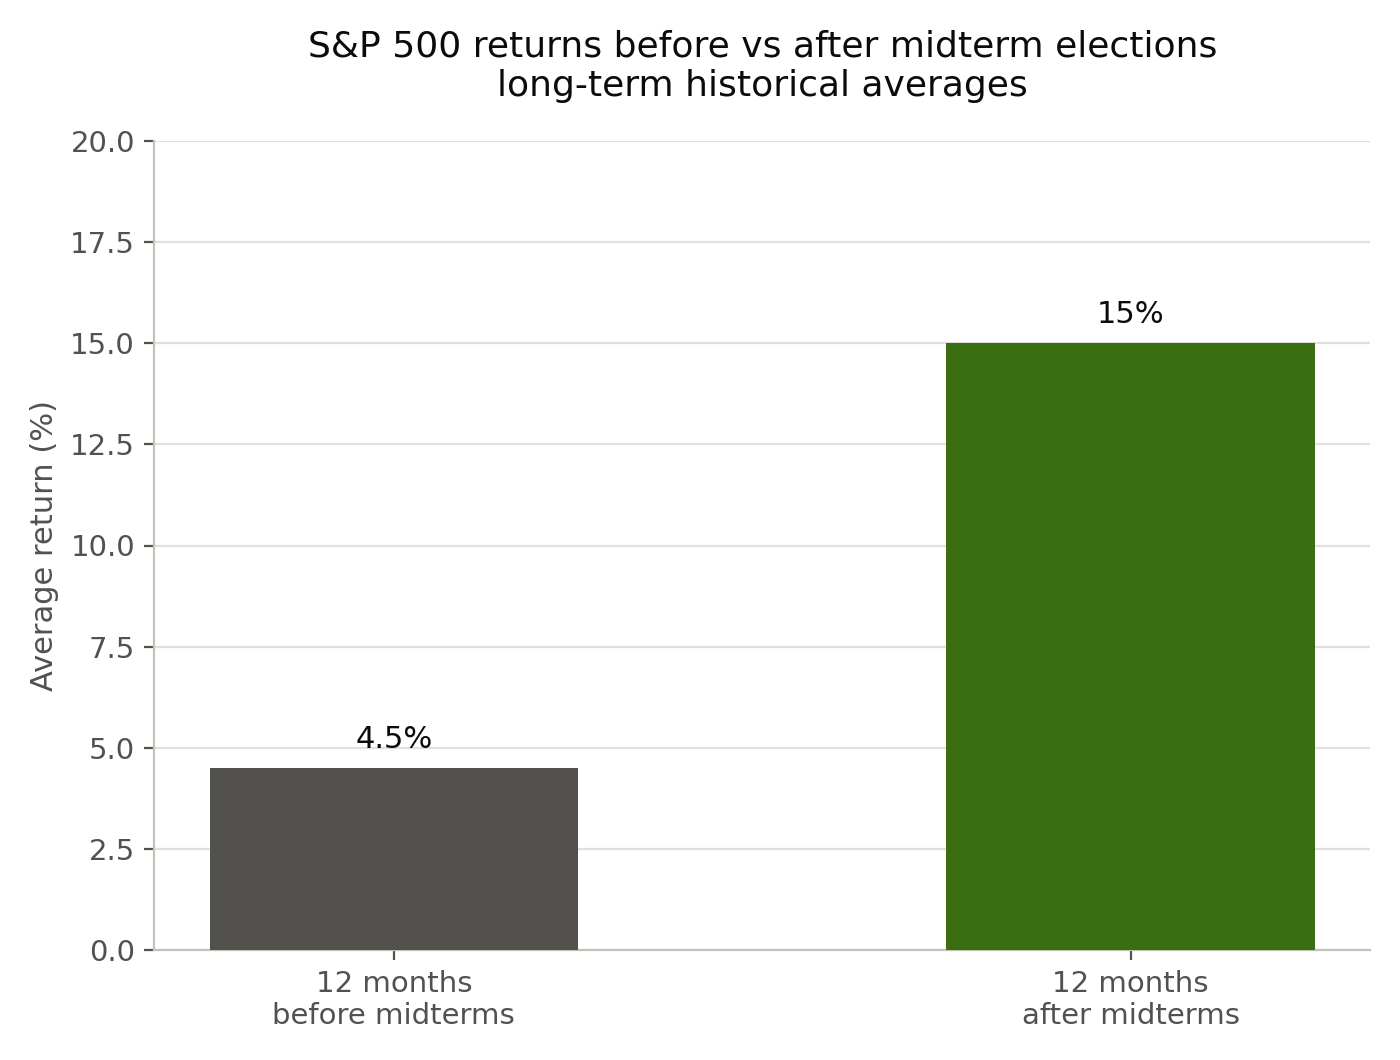
That rebound doesn't stop at year-end, either. Looking at the 12 months following past midterm elections, the S&P 500 has historically gained somewhere between 12% and 17% on average, depending on the exact period studied. Multiple long-term studies going back to the 1960s or earlier have found a positive return in every single 12-month stretch following a midterm election.
What's Different About 2026
Here's where this year has actually broken from the script, at least so far.
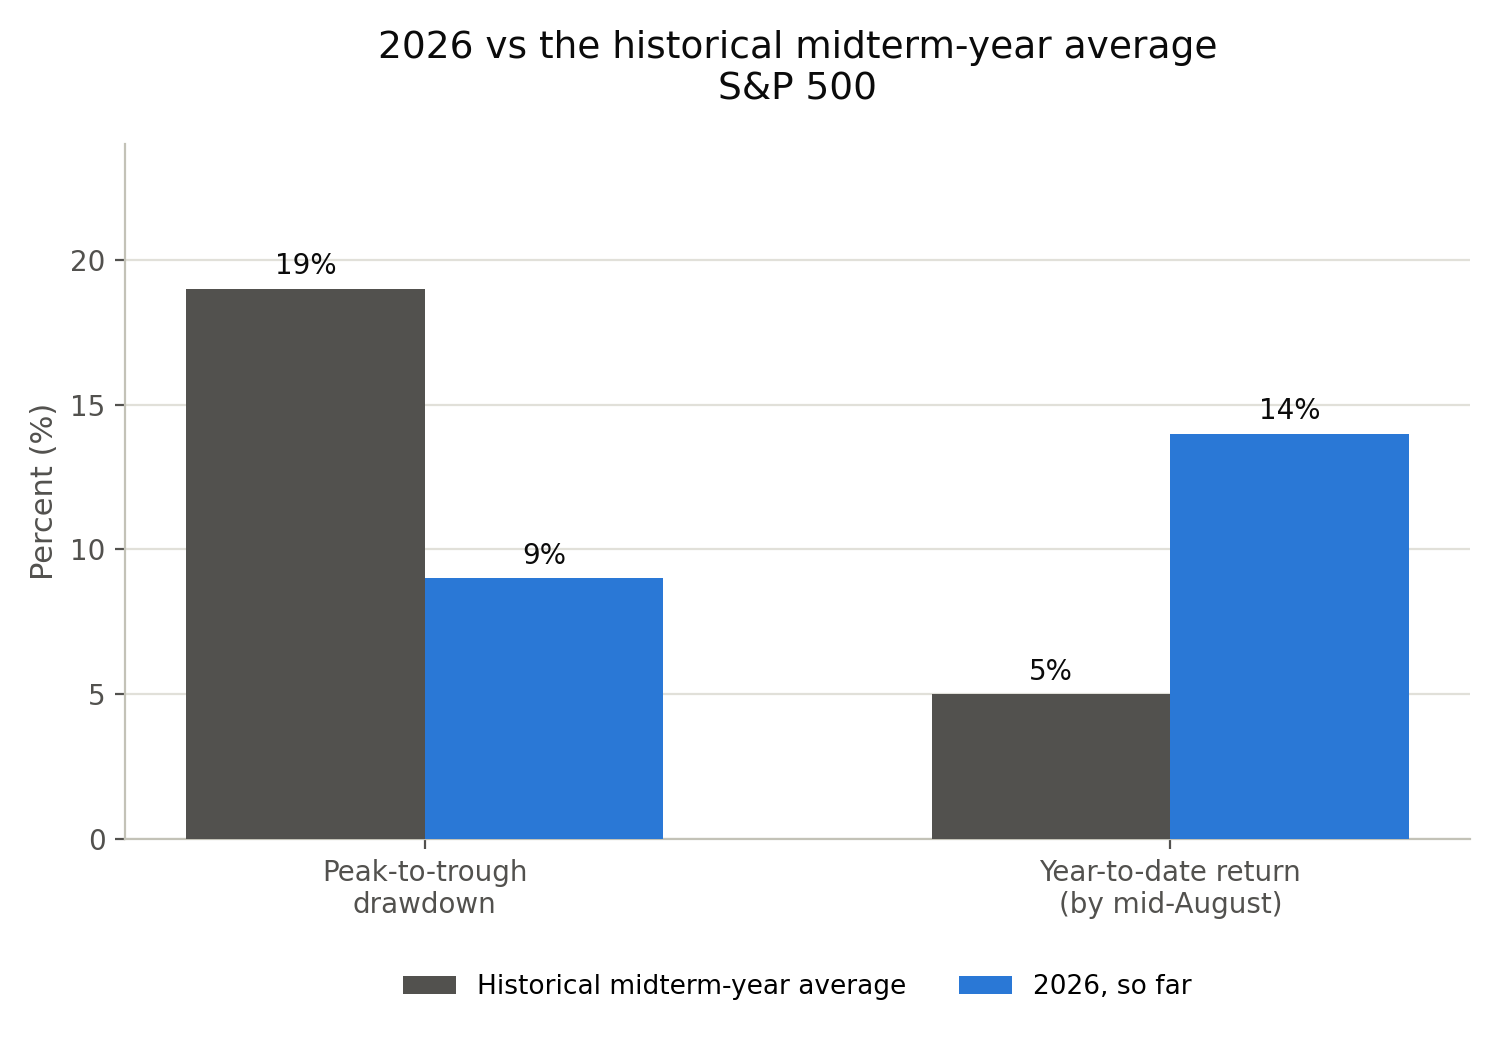
The S&P 500 started 2026 strong, climbing to around 7,000 in January. Then, as tensions in the Middle East escalated in March, stocks pulled back roughly 9% from that peak, a real drop, but well short of the typical 19% midterm-year drawdown. The market recovered sharply through April, and by mid-August, the S&P 500 was up about 14% for the year, far ahead of the historical midterm-year average.
Even so, investors have felt unusually uneasy. A measure of economic policy uncertainty published by the Federal Reserve Bank of St. Louis surged to more than eight times its long-term average earlier this year. Oil prices, inflation, interest rates, and questions about how much AI-related spending is actually worth have all been on investors' minds, alongside the usual pre-election noise.
The Political Backdrop Heading Into November
Voters head to the polls on November 3, 2026, to decide all 435 House seats and 35 Senate seats. Polling has shown Democrats with a modest edge on the generic ballot, and history tends to favor the party outside the White House in midterms, going back to sizable seat losses for the president's party in 2010, 2018, and 2022.
Most forecasts point to a competitive outcome: Democrats seen as favored to retake the House, Republicans seen as favored to hold the Senate, which would produce a divided Congress. Some analysts expect divided government to have a fairly muted effect on markets either way, since major ongoing policy themes, like tariffs and interest rate policy, are largely set by forces beyond just one chamber of Congress.
Wall Street research desks have modeled out a few different scenarios. Broadly, continued unified Republican control has been framed by some analysts as the most market-friendly outcome, a divided Congress as roughly neutral, and full Democratic control as the outcome with the most mixed sector-level effects. These are forecasts, not guarantees, and they vary from firm to firm.
What Analysts Are Actually Watching
Most major research desks agree on one thing: the election itself probably matters less to markets than the economic backdrop surrounding it. Corporate earnings, Federal Reserve decisions, inflation trends, and how the AI investment boom plays out are all seen as bigger drivers of where stocks head next than which party ends up with more seats.
What This Means for You as an Investor
- Don't treat a midterm year's volatility as a reason to jump out of the market. Historically, the period right after midterms has often rewarded patience.
- Resist the urge to reposition your portfolio based on who you expect to win. Research consistently finds this rarely helps, and often hurts.
- Keep the bigger picture in view. Earnings, interest rates, and inflation have historically shaped long-term returns far more than any single election.
- Remember that averages hide a wide range of outcomes. Not every midterm year, or every post-election year, plays out the same way.
- For active investors, short term trading tips on US stocks should ideally be considered alongside price action, volume, market trends, earnings and risk management rather than election headlines alone.
Conclusion
History offers a reassuring pattern: choppier waters through a midterm year, followed by calmer, often stronger ones once the votes are counted. 2026 has already written its own twist on that story, stronger gains and a shallower dip than usual, even as investor nerves stayed unusually frayed underneath.
The safest lesson may be the simplest one: vote with your ballot, not with your portfolio.