Introduction
A stock is paying you 9% a year just to hold it. Is that the best deal on the market, or the biggest red flag you're about to ignore?
High dividend yields have a way of grabbing attention. They look like free money. But sometimes that shiny number is less a reward and more a warning label. Let's figure out how to tell the difference.
What Is Dividend Yield, Really?
Dividend yield is just a percentage. It tells you how much a company pays you each year compared to what you paid for the stock.
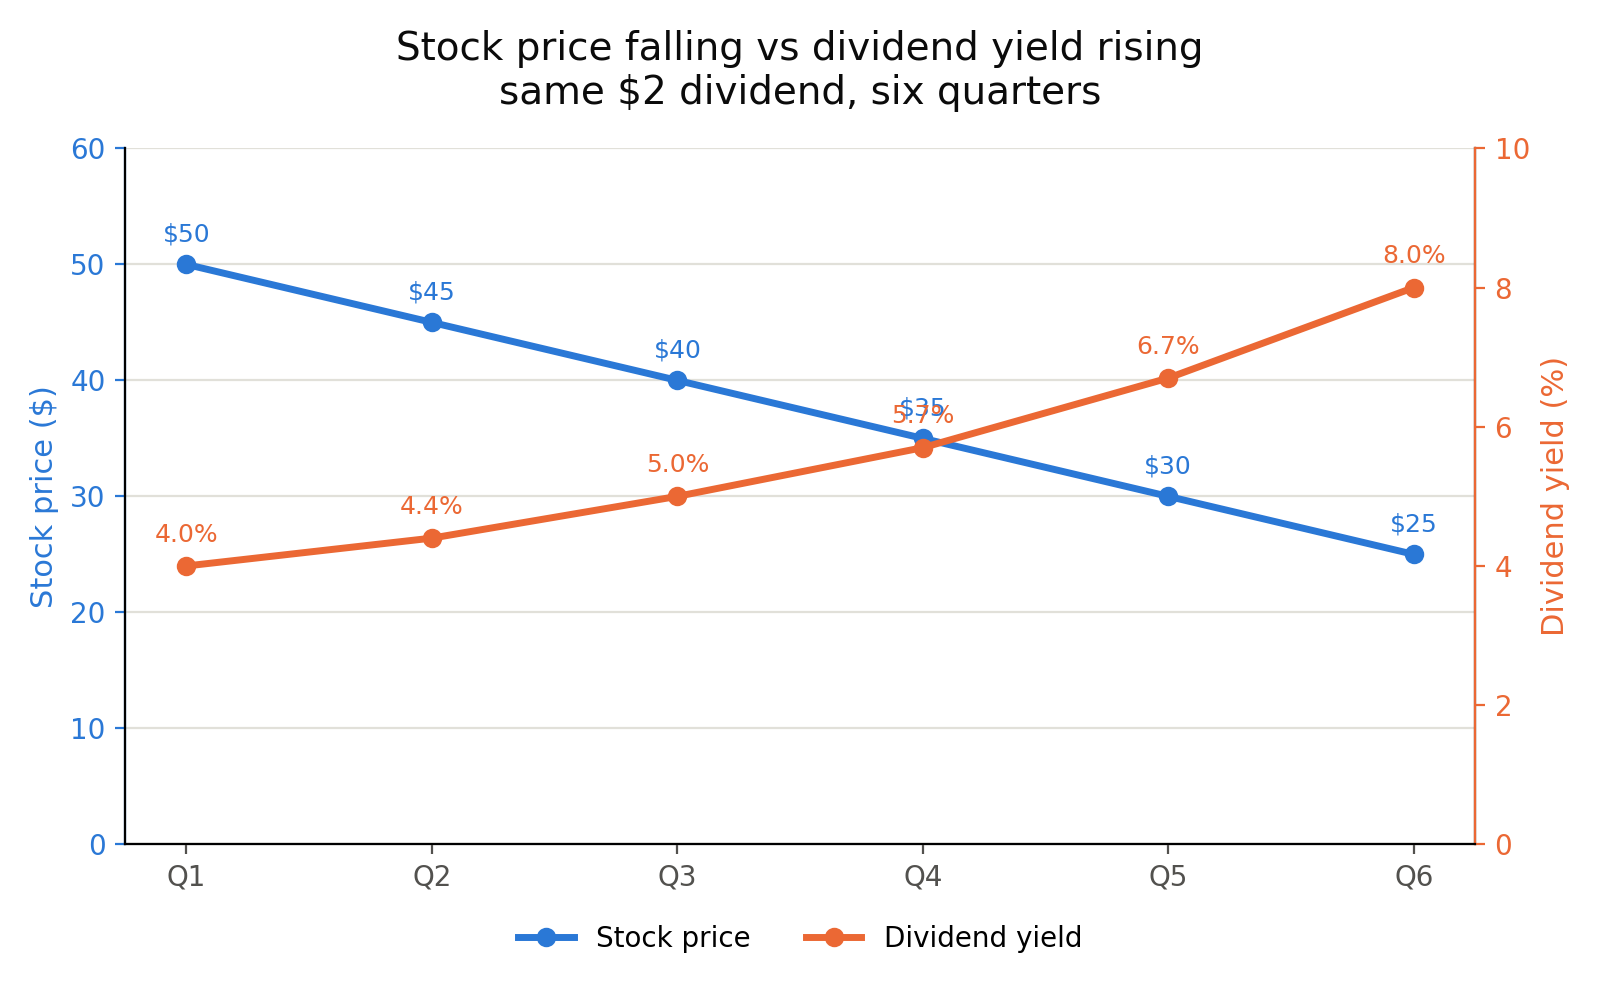
Say a stock trades at $50 and pays $2 a year in dividends. Divide $2 by $50 and you get 4%. That's the yield.
Think of it like a cash back rate. A 4% yield means you're getting $4 back every year for every $100 you invested, on top of whatever the stock itself does.
Why a High Yield Feels Like a Bargain
Many income-focused investors also use trading advisory services for USA stocks to identify fundamentally strong dividend-paying companies rather than relying on dividend yield alone.
A 4% yield is nice. A 9% yield feels amazing. More income for the same dollar invested, what's not to love?
This is exactly why high yield stocks pull people in. They promise bigger paychecks for doing nothing but holding on. But yield is only half the story. The other half is why that yield got so high in the first place.
The Hidden Math: Two Ways a Yield Gets High
Remember, yield is dividend divided by price. That means it can climb for two very different reasons.
Reason one: the dividend grows. The company is doing well, raising its payout, and the stock price hasn't caught up yet. This is the genuine bargain.
Reason two: the price falls. The dividend stays exactly the same, but the stock price drops because investors are worried. The math still pushes the yield higher, even though nothing good is happening underneath.
This second case is called a yield trap. The number looks generous, but it's often a company quietly heading for trouble, with a dividend cut waiting to happen.
How a Yield Trap Forms
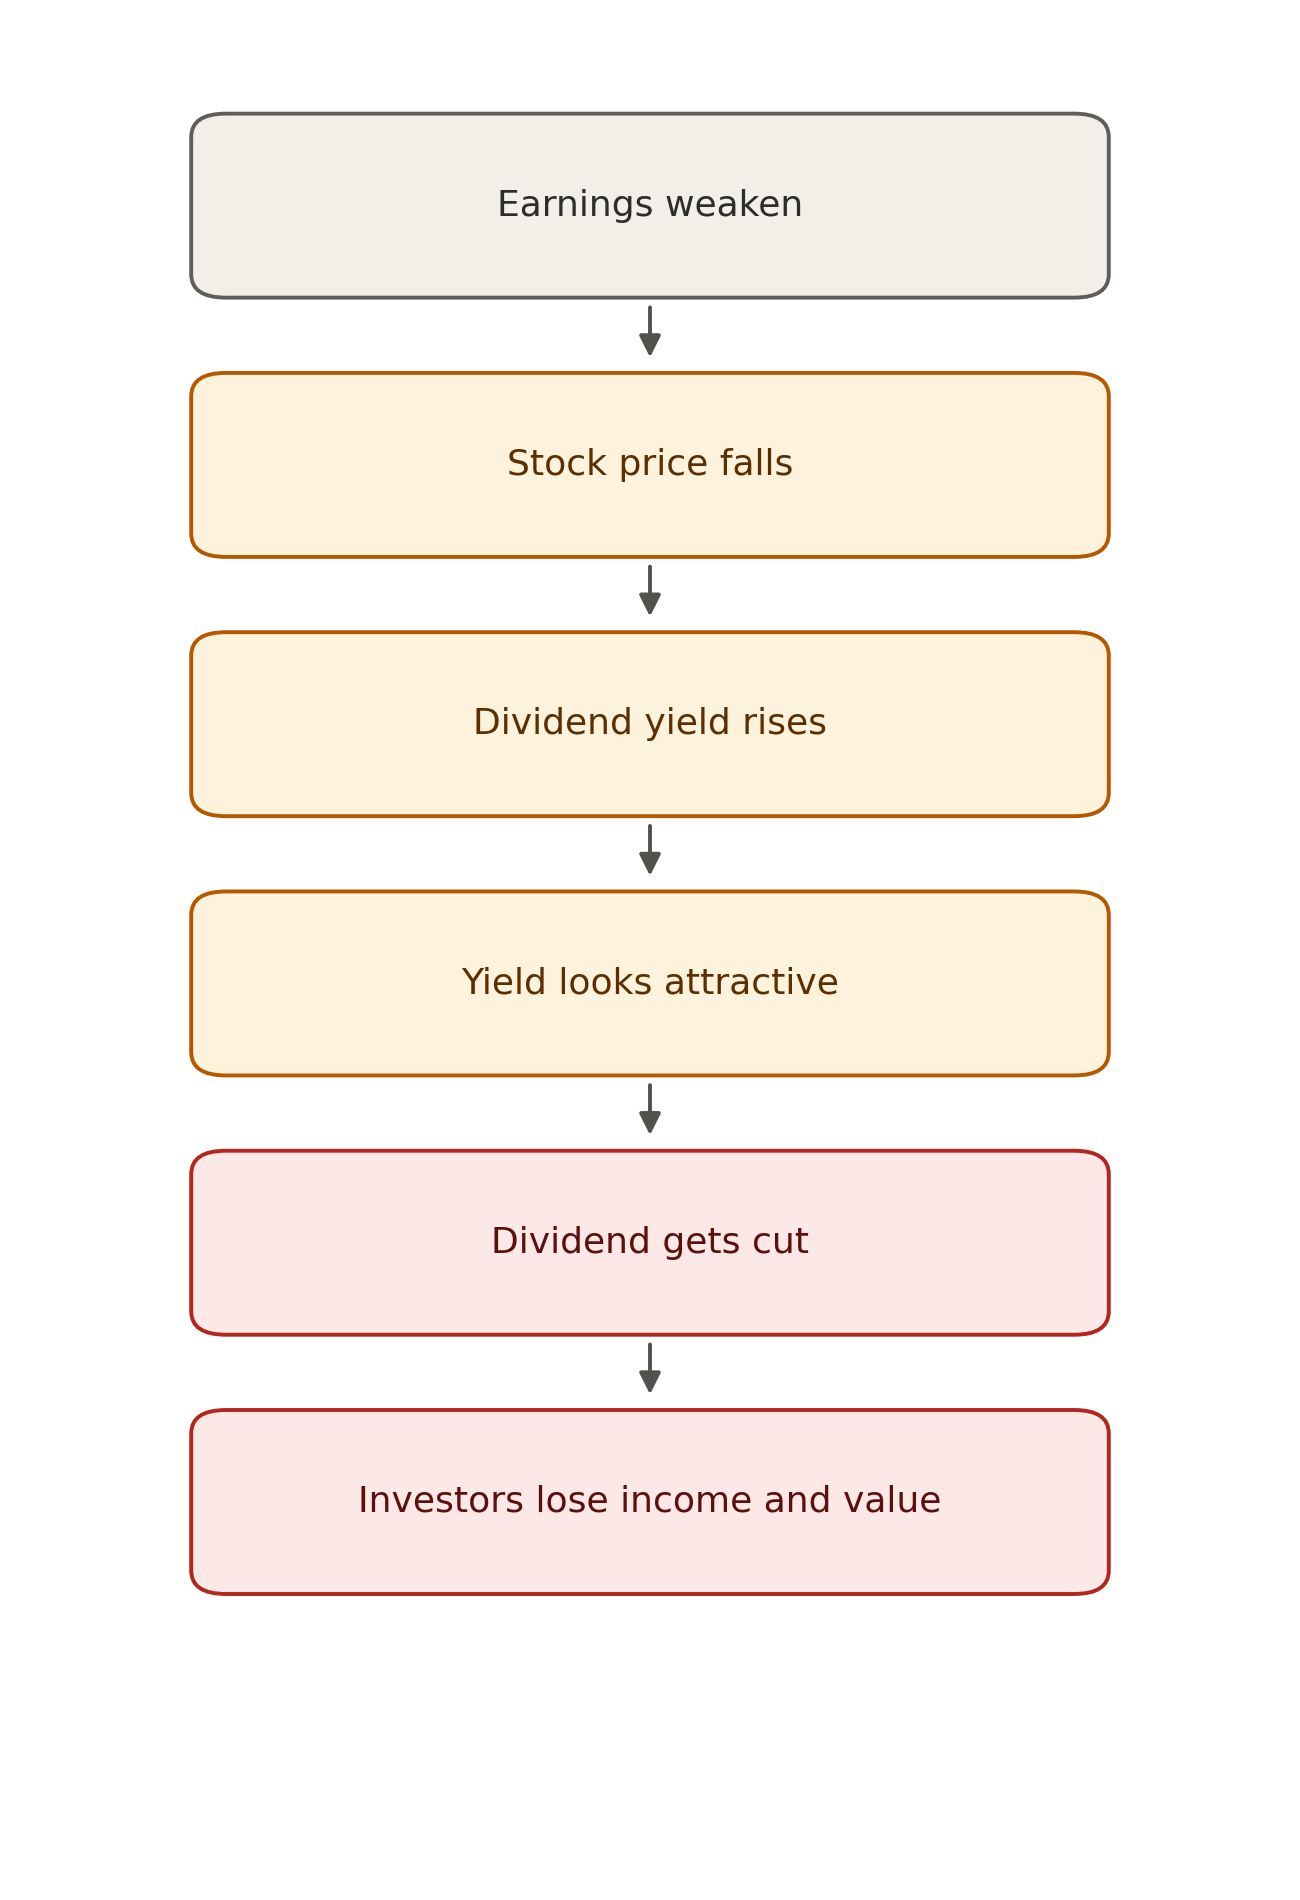
Notice the yield rises before the bad news arrives, not after. By the time most investors notice the high yield, the company's problems are usually already underway.
Two Companies, Two Very Different Stories
Let's look at two fictional companies.
HealthySnacks Co. sells snack bars. Its business is steady, earnings are growing, and it raises its dividend a little every year. Its yield sits around 3%.
OldMall Retail Inc. runs shopping malls that are losing customers to online stores. Its stock price has fallen by half over the past year. Its dividend hasn't changed, so its yield has jumped to 11%.
| Factor | HealthySnacks Co. | OldMall Retail Inc. |
|---|---|---|
| Why the yield looks attractive | Business is healthy, dividend is growing | Stock price has crashed |
| Earnings trend | Rising steadily | Falling |
| Payout ratio | 45%, comfortable | 140%, paying out more than it earns |
| Likely next move | Dividend keeps growing slowly | Dividend at risk of a cut |
Six months later, HealthySnacks raises its dividend again. OldMall Retail cuts its dividend in half, and the stock falls further. The yield that looked exciting was really a smoke signal.
Red Flags vs Green Flags
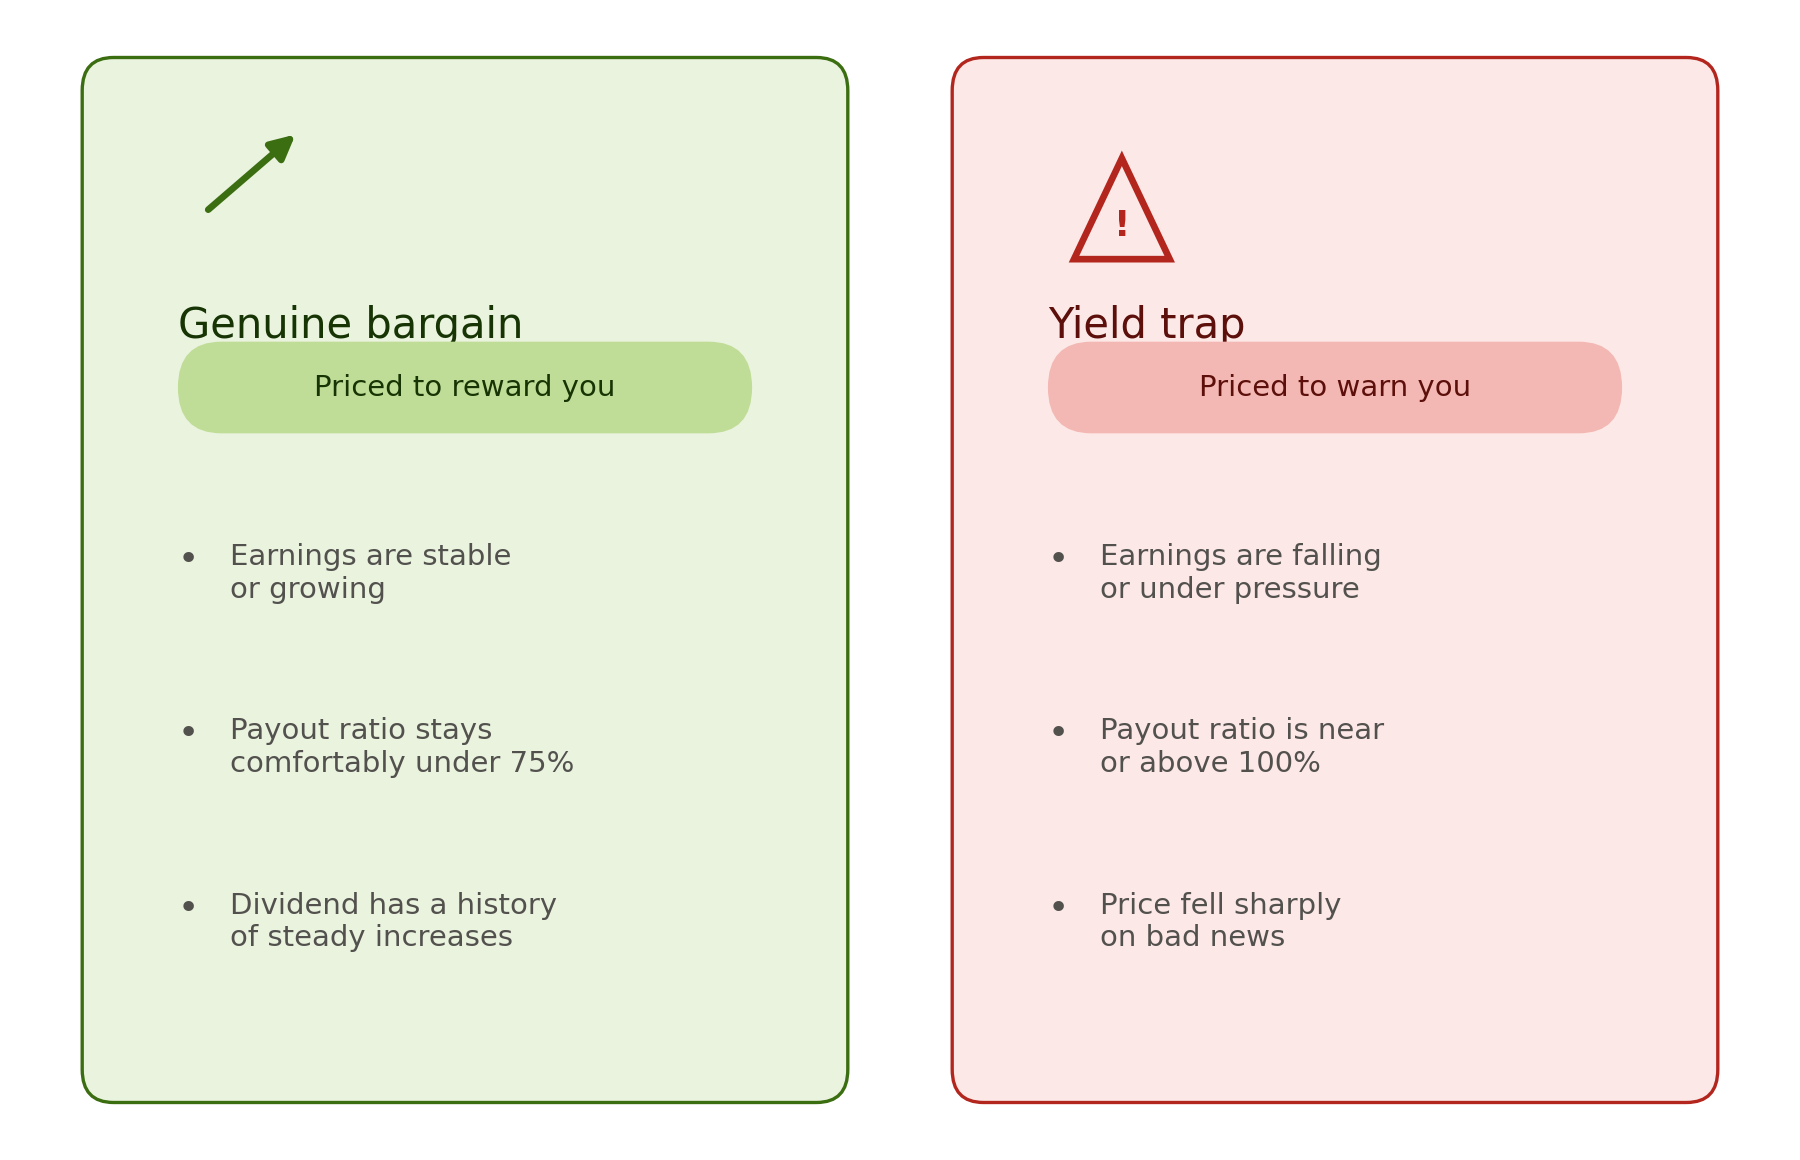
Here's a quick way to sort the two apart.
| Signal | Genuine Bargain | Yield Trap |
|---|---|---|
| Earnings | Stable or growing | Falling |
| Payout ratio | Comfortably under 75% | Near or above 100% |
| Dividend history | Steady, gradual increases | Long freeze or sudden spike in yield |
| Stock price move | Flat or slowly rising | Sharp, recent decline |
| Industry comparison | Yield close to similar companies | Yield far above similar companies |
What Investors Should Check Before Buying
You don't need to be a professional analyst to spot most yield traps. A few checks go a long way.
- Check the payout ratio. This is the share of a company's profit paid out as dividends. Above 100% means the company is paying out more than it earns, which usually can't last.
- Look at the earnings trend. A rising yield paired with falling earnings is a warning, not a bargain.
- Compare the yield to competitors. If one company's yield is far higher than similar companies in the same industry, ask why.
- Read the recent news. A sudden yield spike almost always has a reason behind it.
- Check the dividend history. Companies with decades of steady increases are far less likely to cut suddenly than ones with a shaky track record.
Whether you're investing for income or long-term growth, quality research matters more than chasing the highest yield. Professional US stock market recommendations can help investors evaluate dividend sustainability alongside earnings, cash flow, and business fundamentals.
Conclusion
A high dividend yield is a bit like a smoke alarm. Sometimes it's just being sensitive. But sometimes it's telling you there's a fire you haven't noticed yet.
The number alone can't tell you which one it is. Only the business behind it can. Check the earnings, check the payout ratio, check the history, and then decide if that yield is a gift or a warning sign in disguise.