- Naranj Research Desk

- 🇸🇦 Saudi Stock Market
- 🇺🇸 USA Stock Market

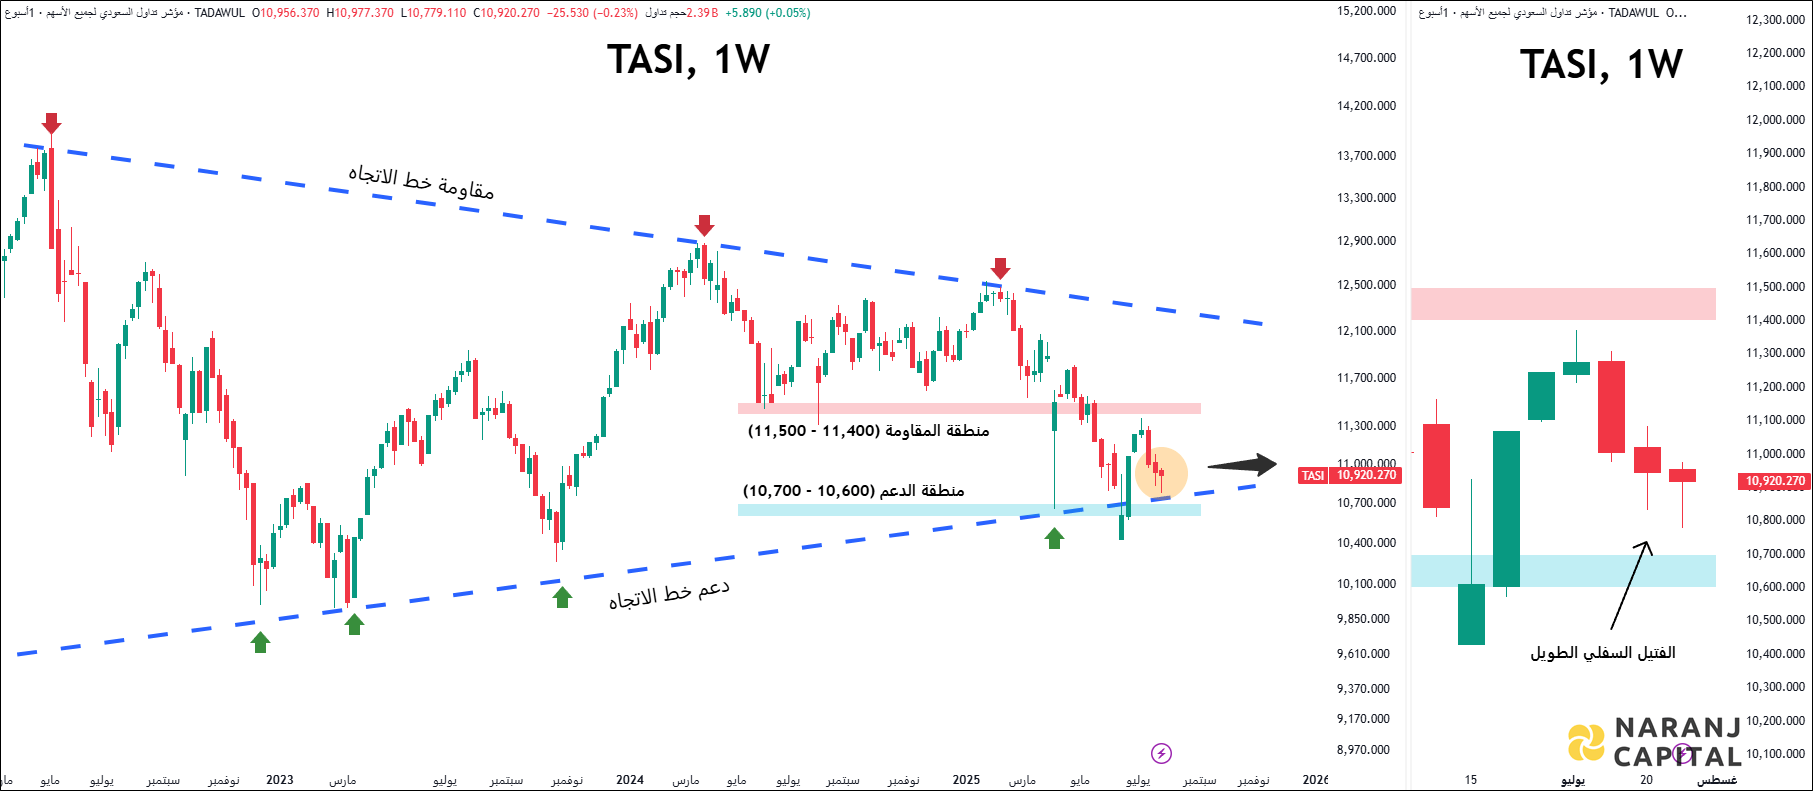
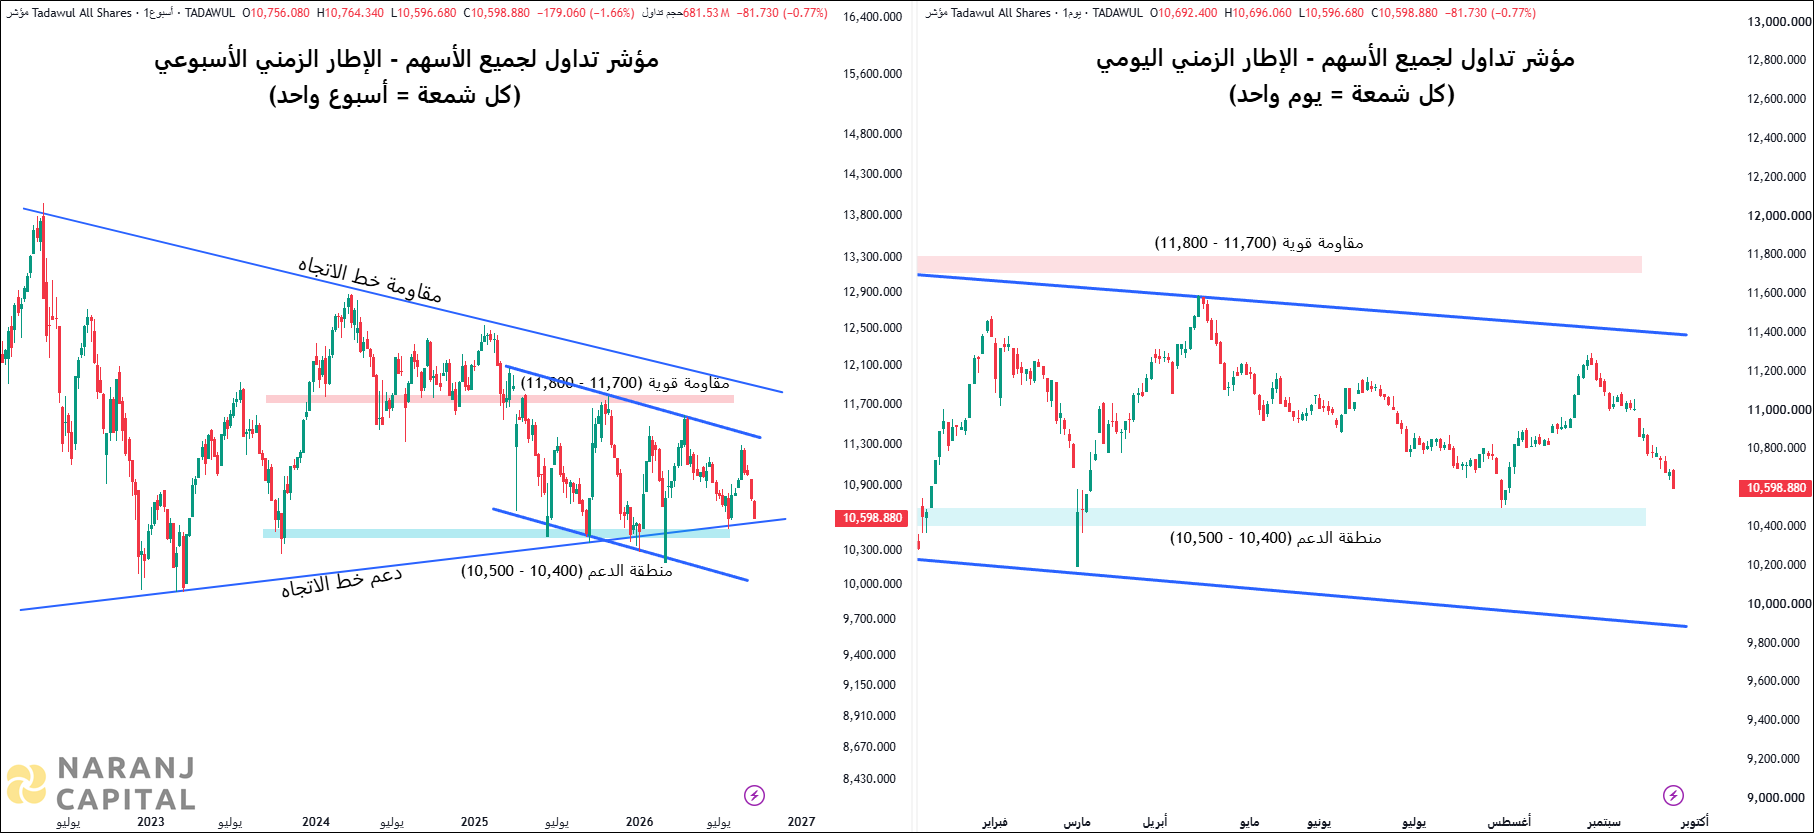
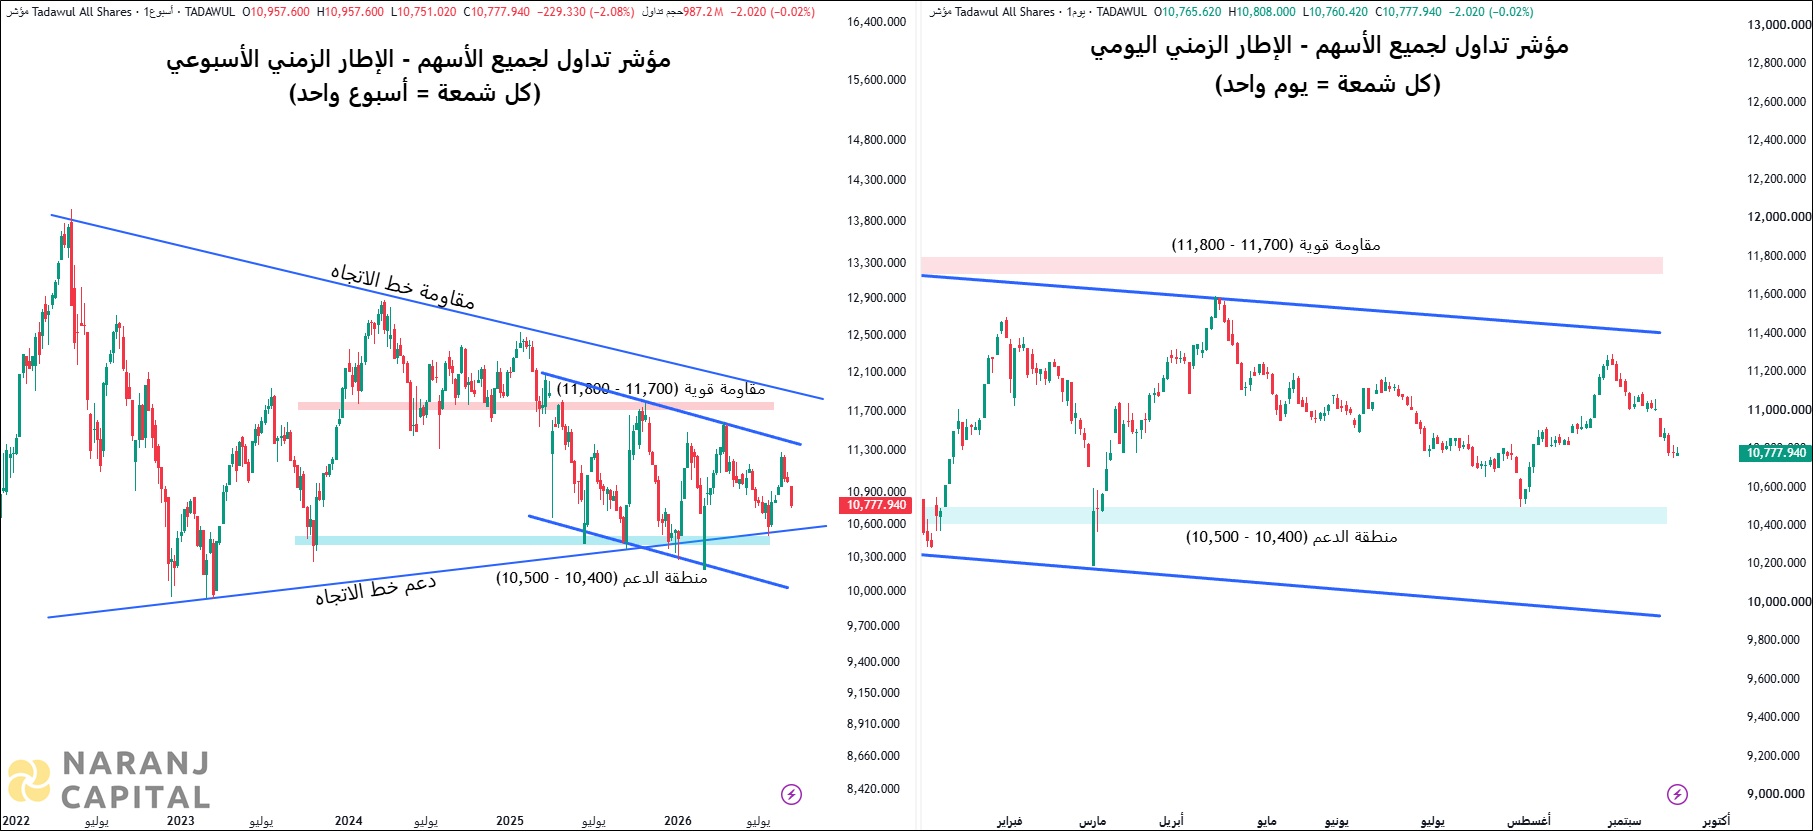
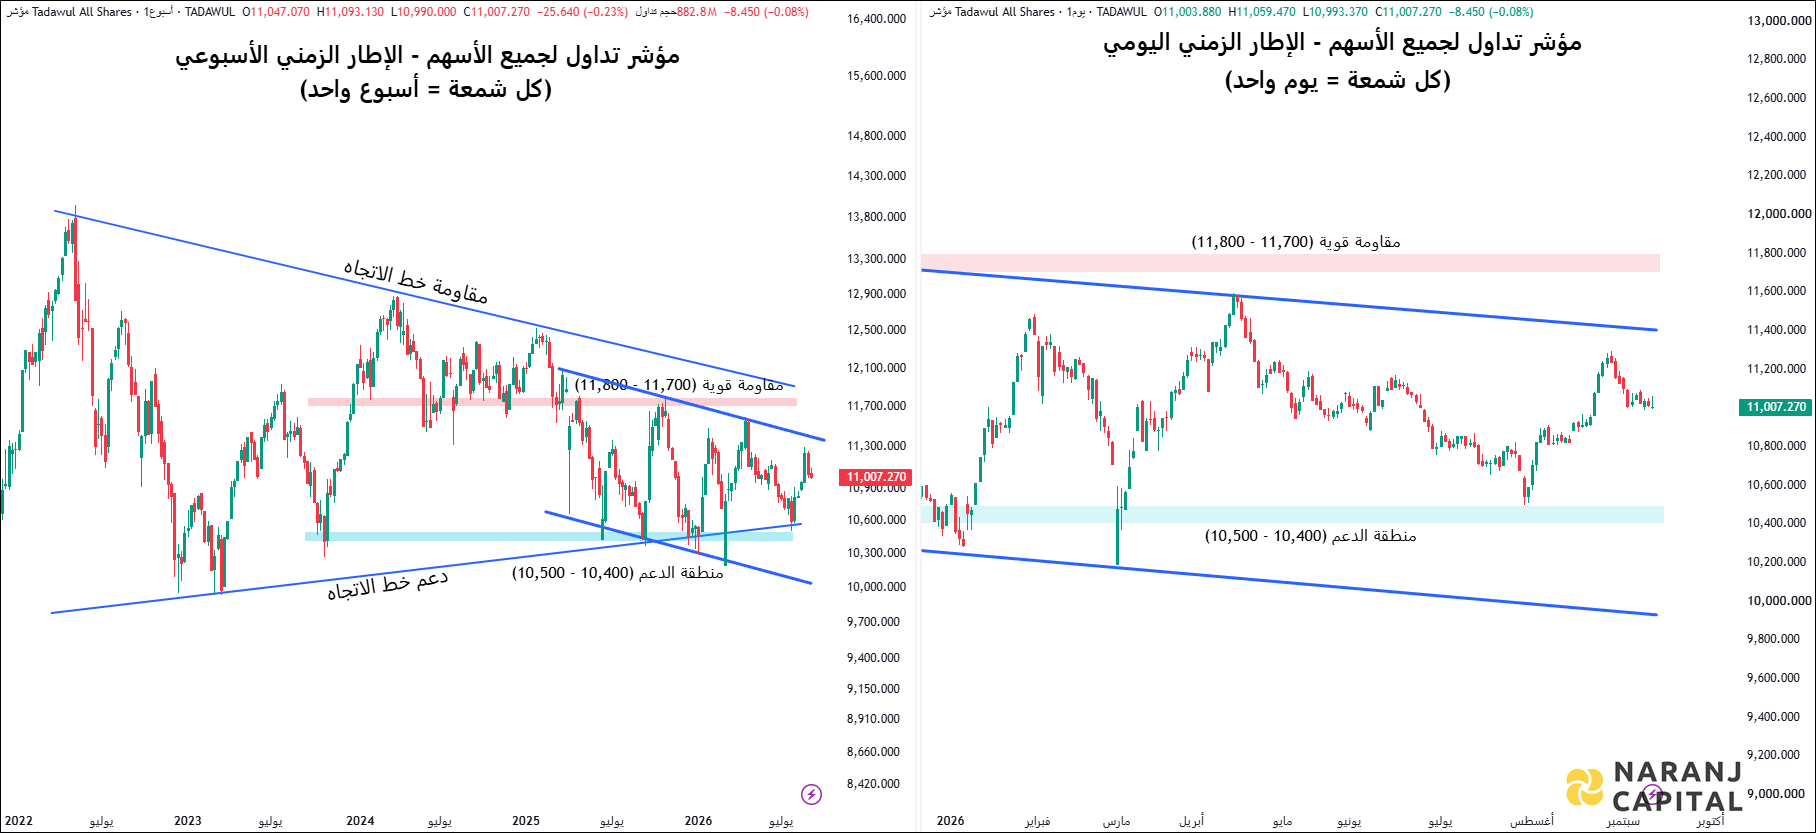
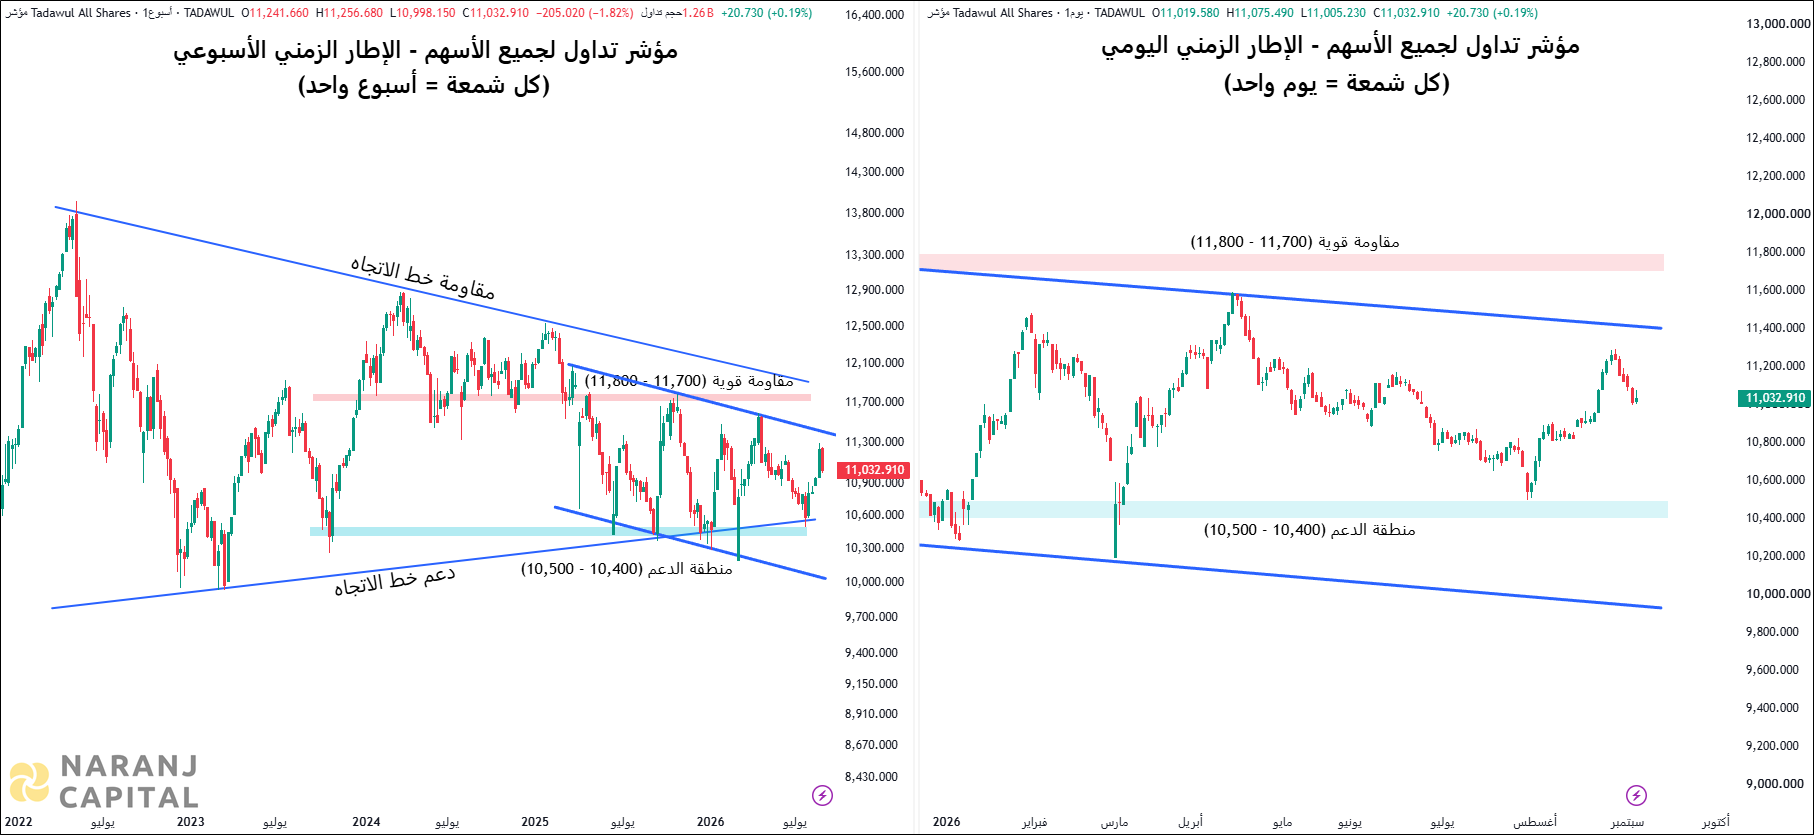
The Tadawul All Share Index (TASI) seems to be taking support at a very important long-term trendline. Over the last two weeks, we’ve seen buyers stepping in at lower levels — we can tell this because the candles on the weekly chart have long lower shadows (wicks), which means prices dropped during the week but recovered before the close.
Also, there’s a strong support area near the 10,700 level, which has helped the index bounce back many times in the past. This shows that the market is trying to form a base and not fall further.
If we look at the daily chart (which shows shorter-term moves), something interesting is happening. While the index is still making lower lows (which usually means weakness), the RSI indicator — which tells us about the strength or weakness of price moves — is making higher lows. This is called a bullish divergence, and it could mean that the selling pressure is reducing, and the market might soon start going up.

But remember — just seeing this sign doesn’t guarantee the market will rise soon. It only tells us that the falling trend might be slowing down.
Right now, the index is stuck in a sideways range of about 800 points. For a strong upward move to begin, TASI needs to break above the 11,500 level.