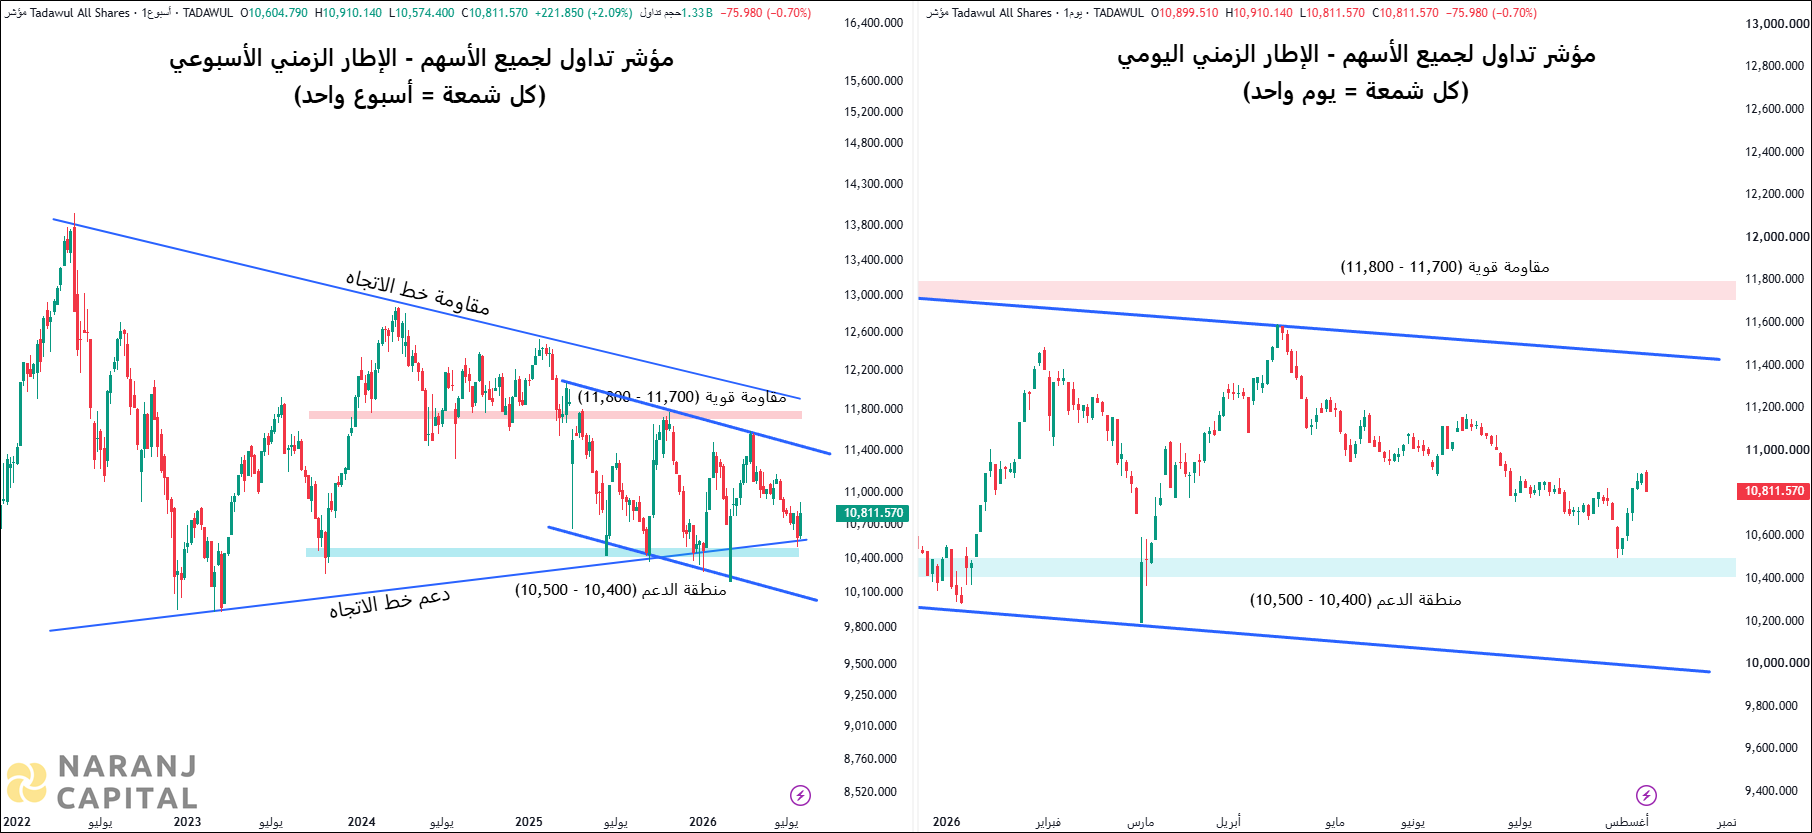
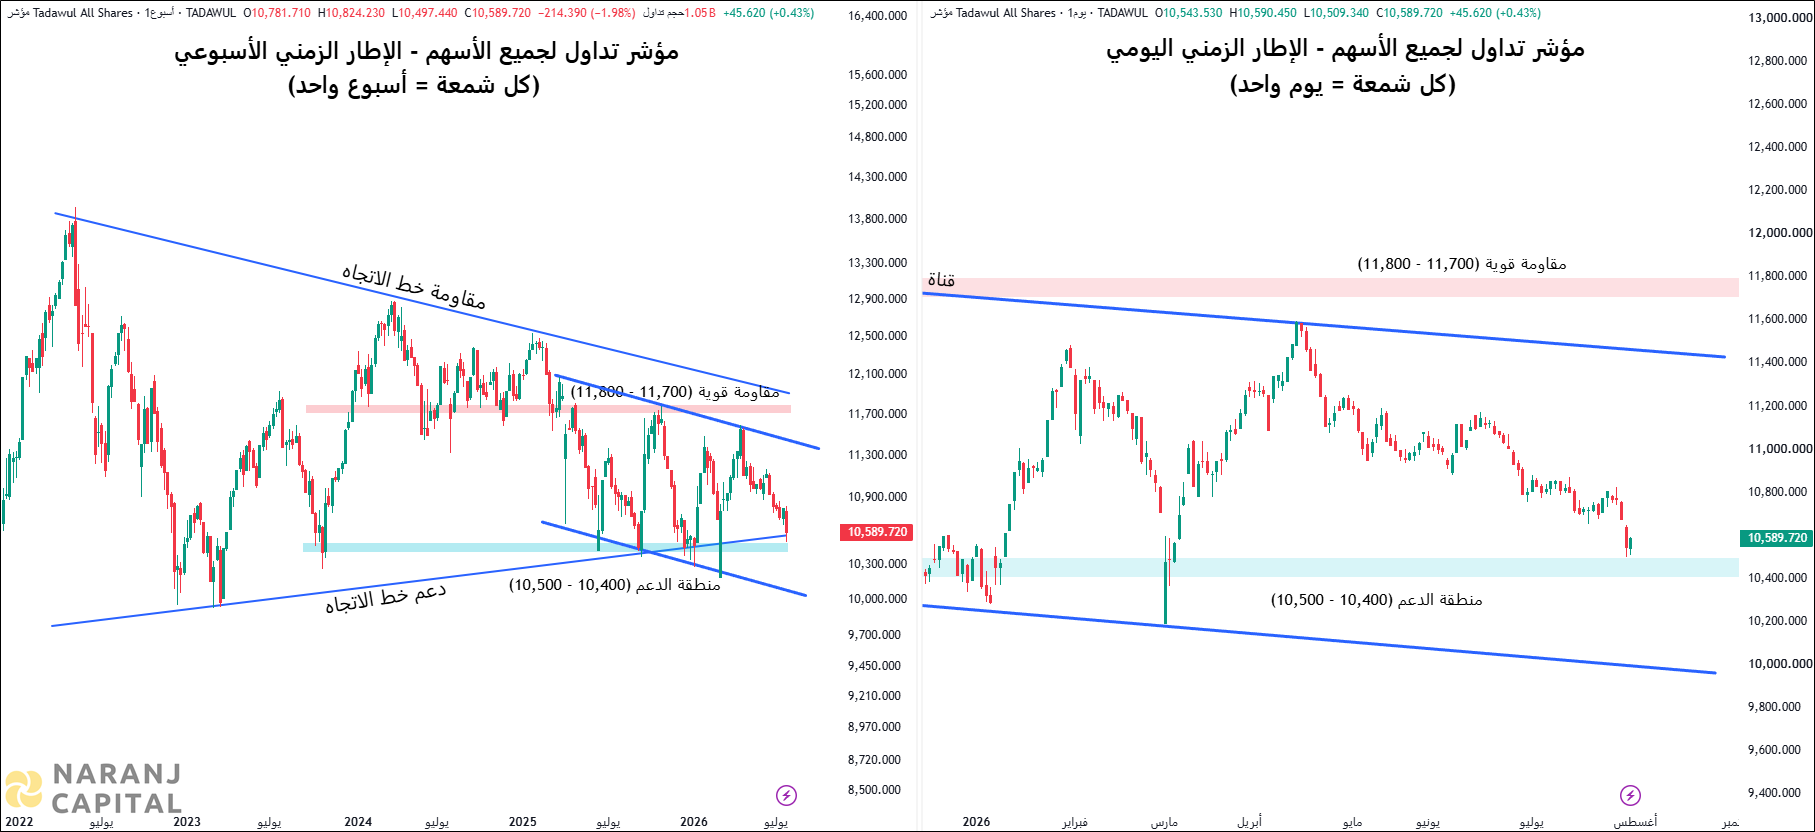
TASI Rebounds Strong: Triangle Pattern Eyes Bullish Leap

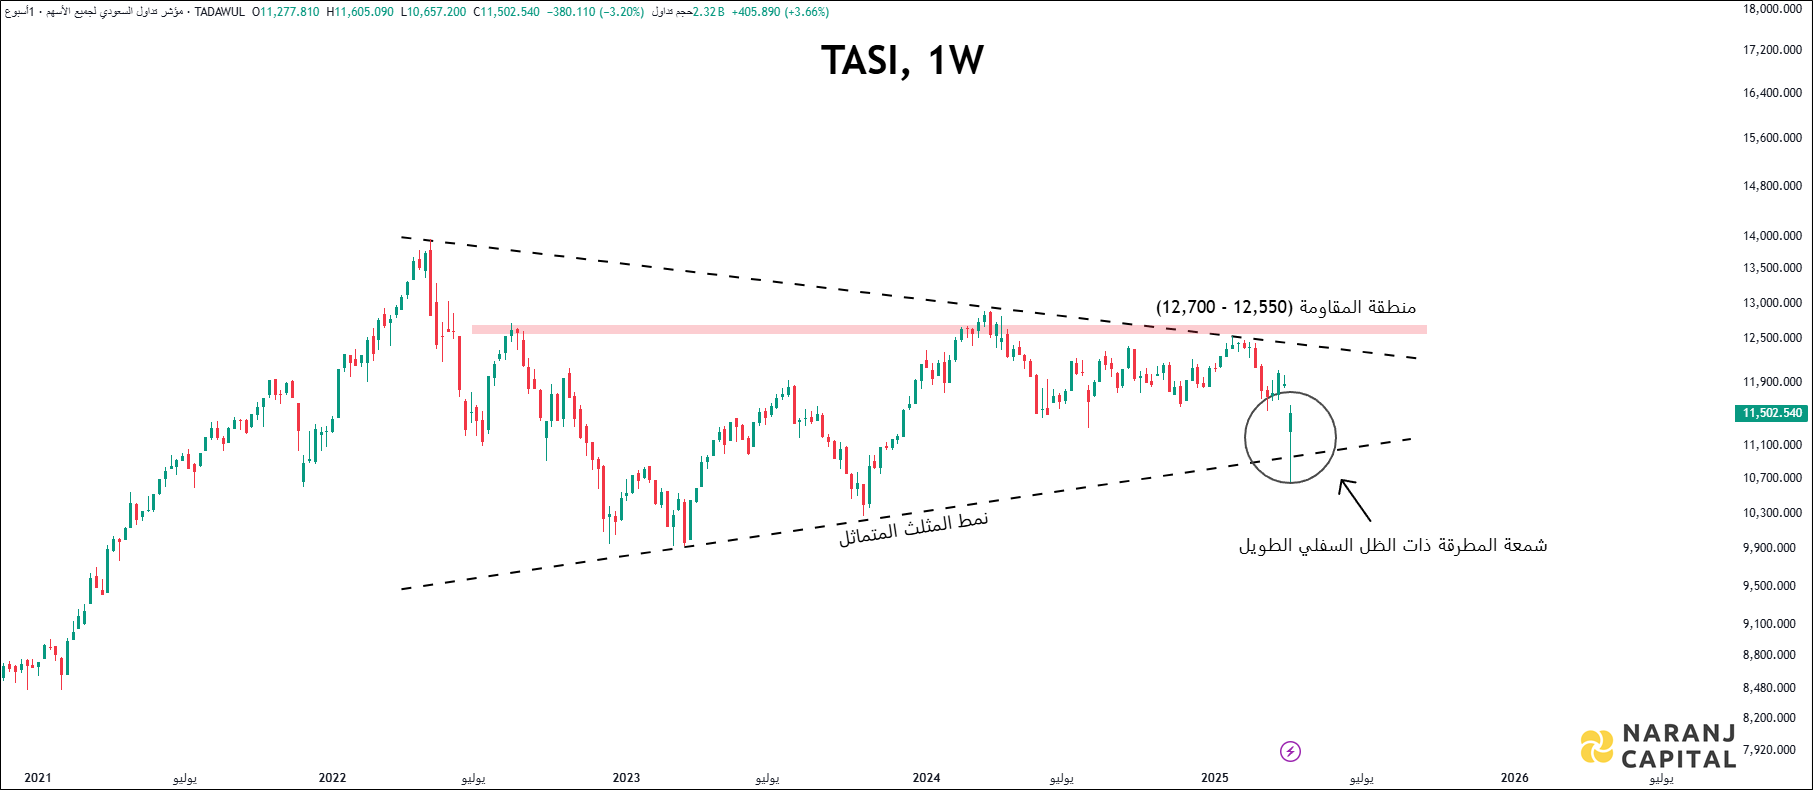
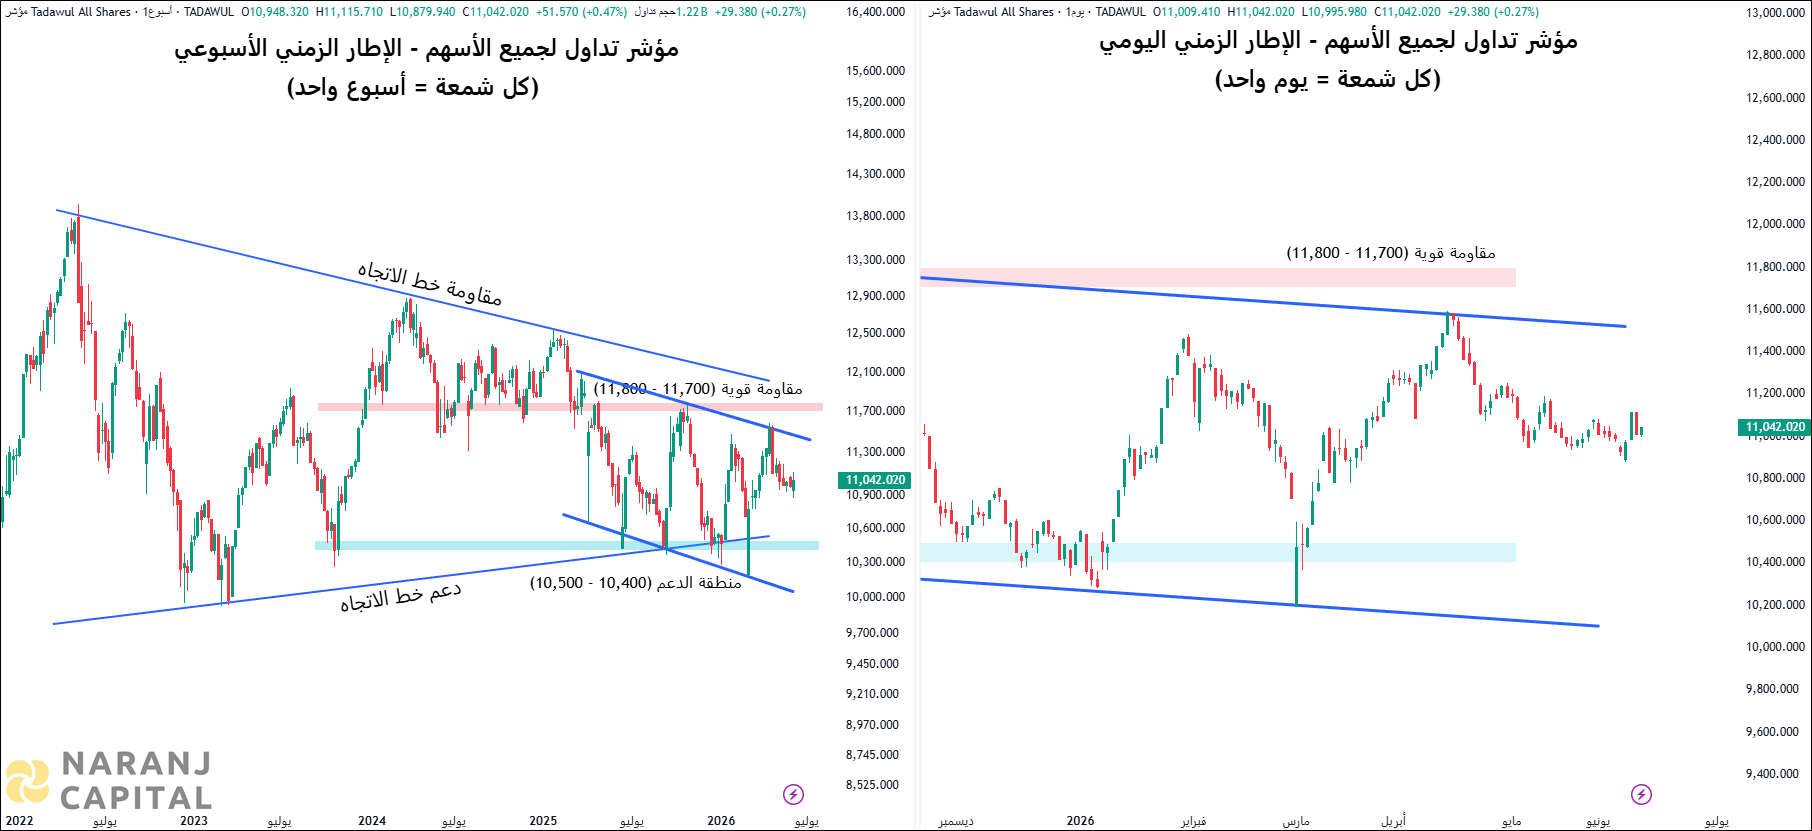
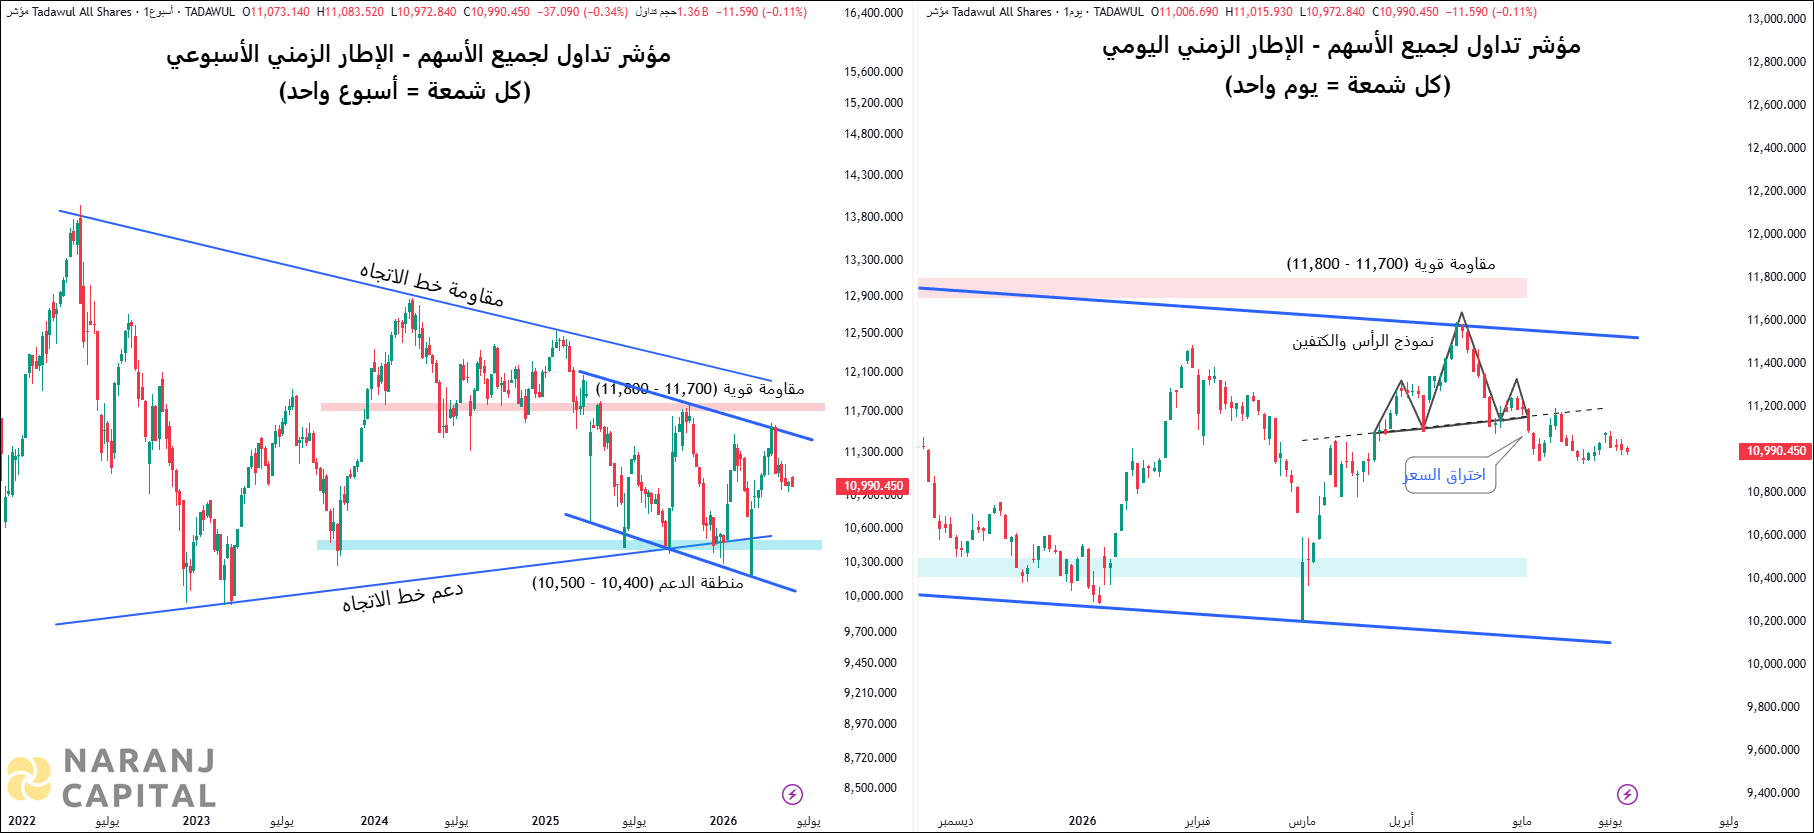
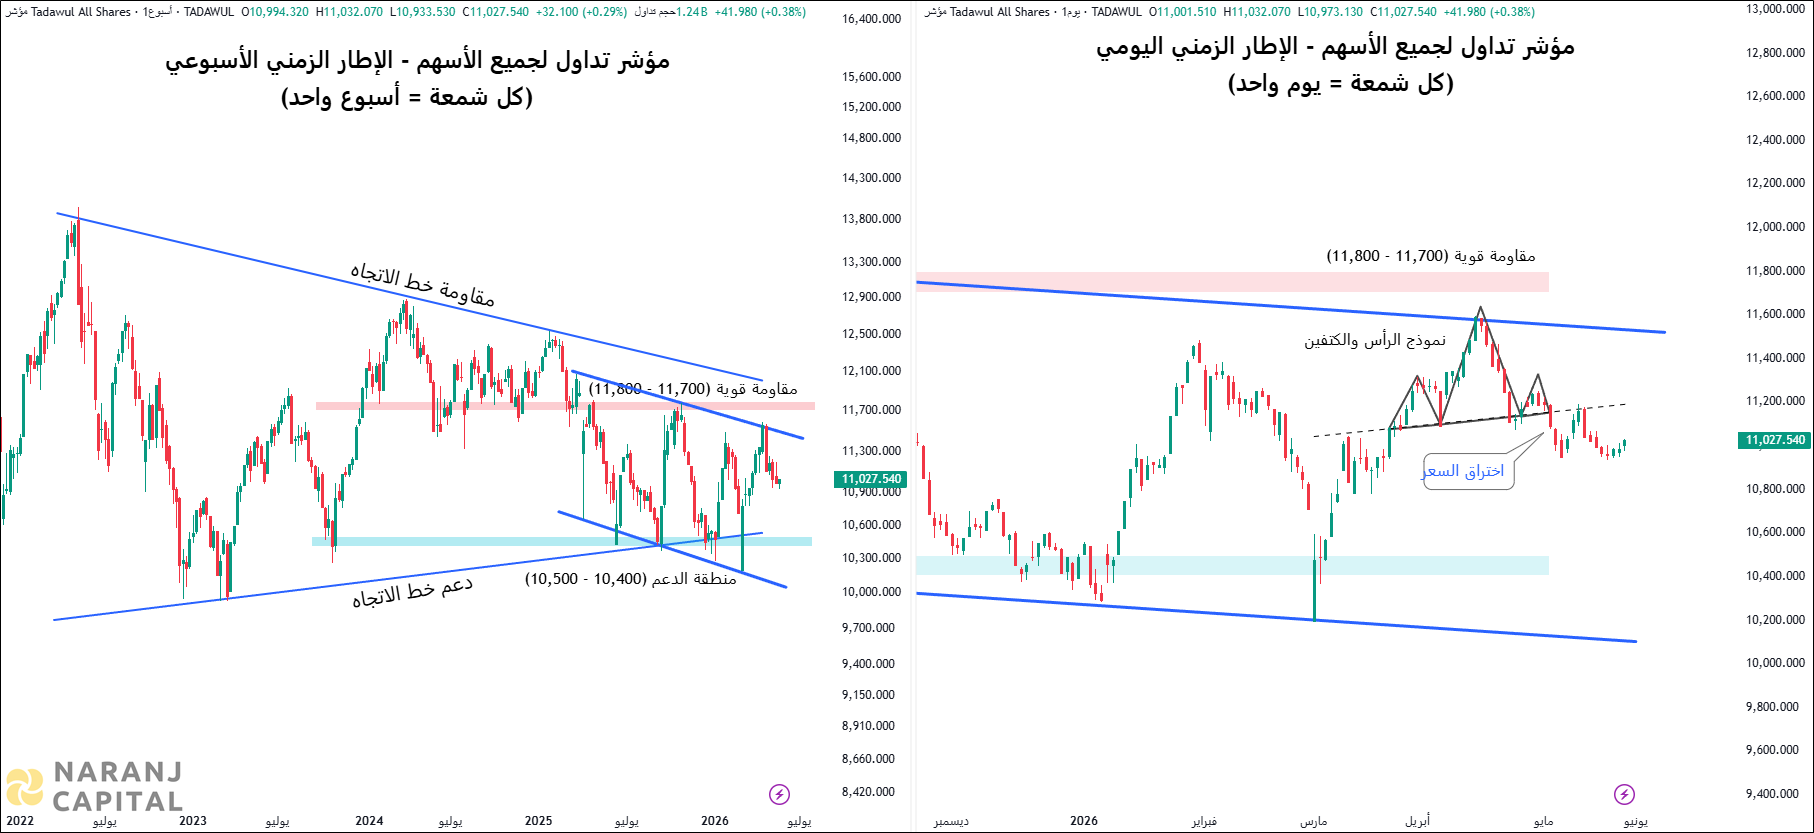
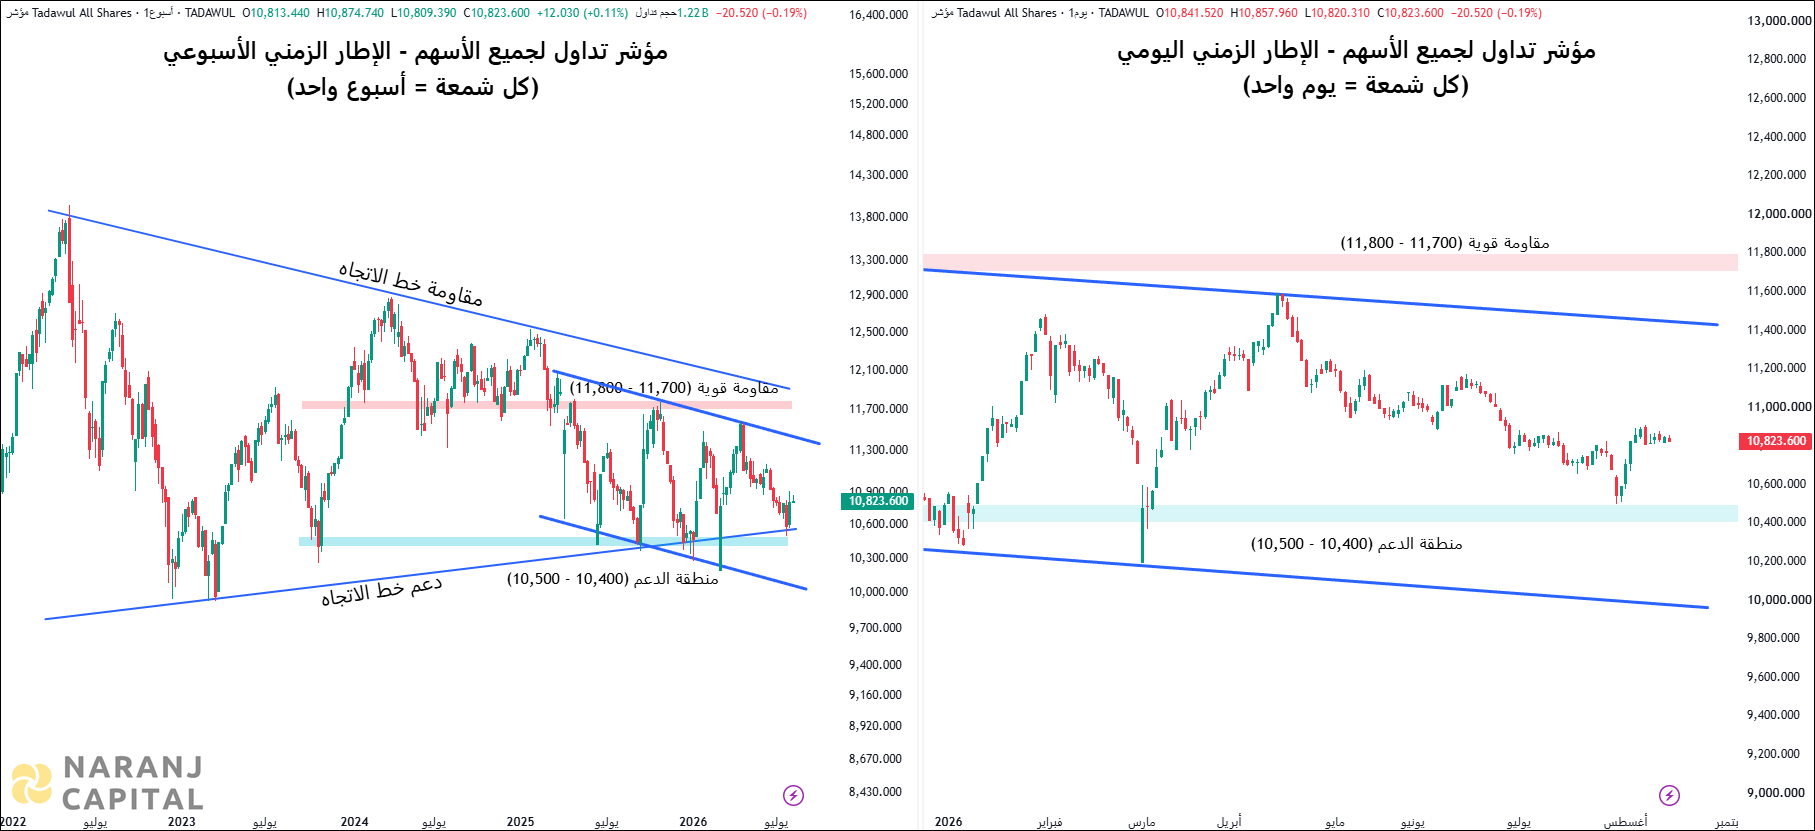
  • The TASI index experienced significant volatility last week, following global market trends. A sharp gap-down and heavy selling pushed it below 11,000, but it rebounded strongly and is now trading just above 11,500.

    A symmetrical triangle pattern has formed on the chart, with a long lower shadow hammer this week suggesting a potential upward move in the near term.

    A key resistance zone has been identified between 12,550 and 12,700. A breakout above this level could trigger a substantial bullish move.

  • Share with
    0 0 votes
    Article Rating
    Subscribe
    Notify of
    guest
    0 Comments

    Join Our Telegram Channel for Saudi Stock Market Update

    Join Naranj Capital on Telegram for free stock alerts

    Recent Articles

    Join Our Telegram Channel for USA Stock Analysis Update

    Join Naranj Capital on Telegram for free stock alerts

    Join Our Telegram Channel

    Naranj Capital trading performance vector graphic
    Naranj Capital stock advisory app preview