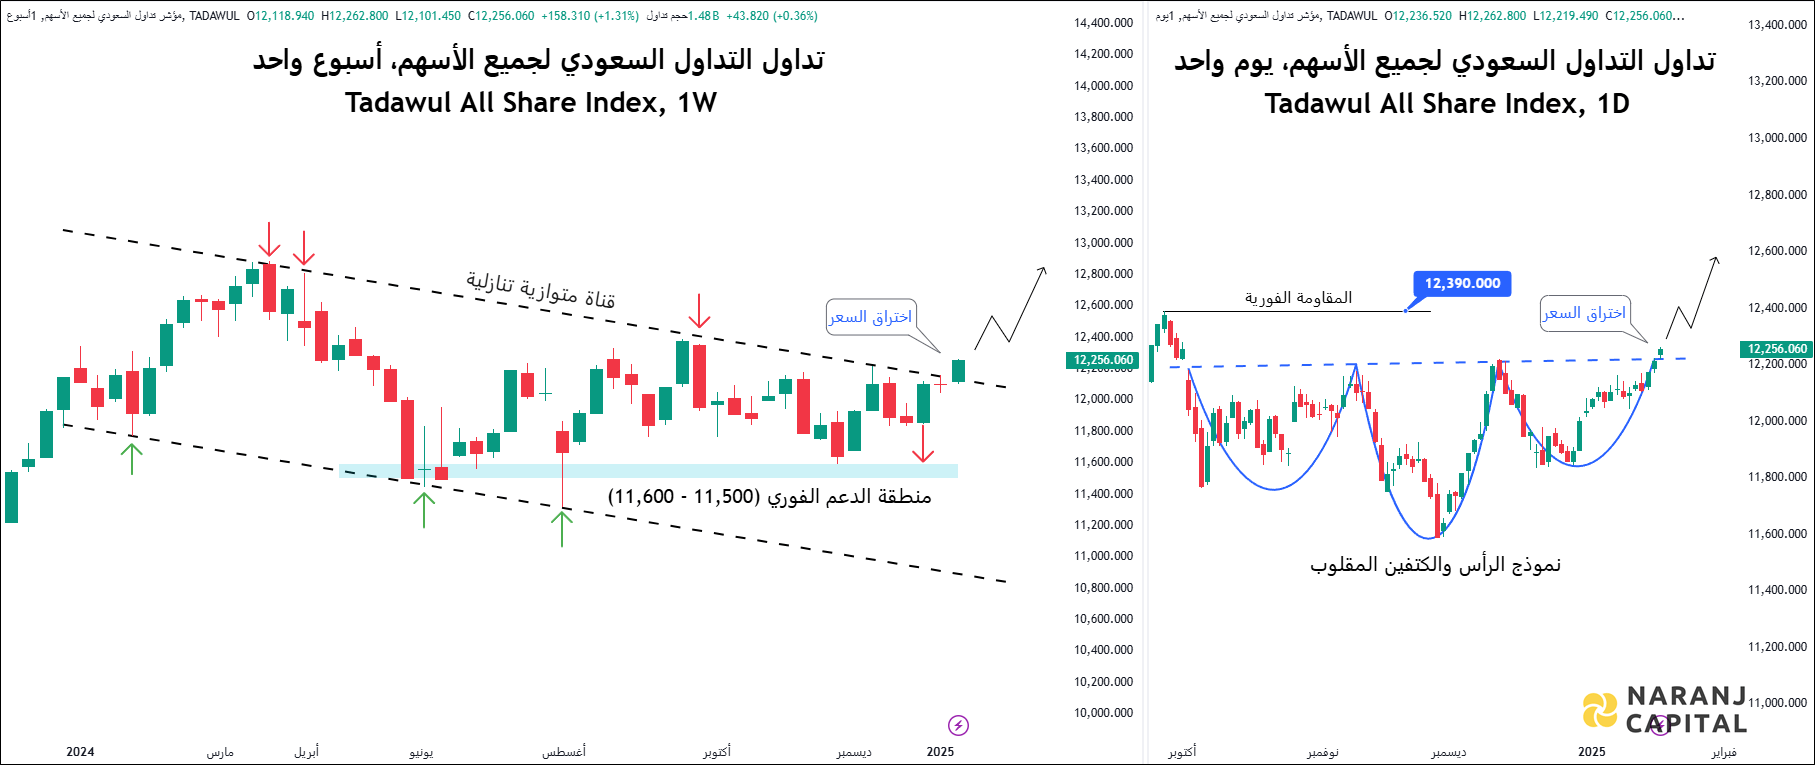
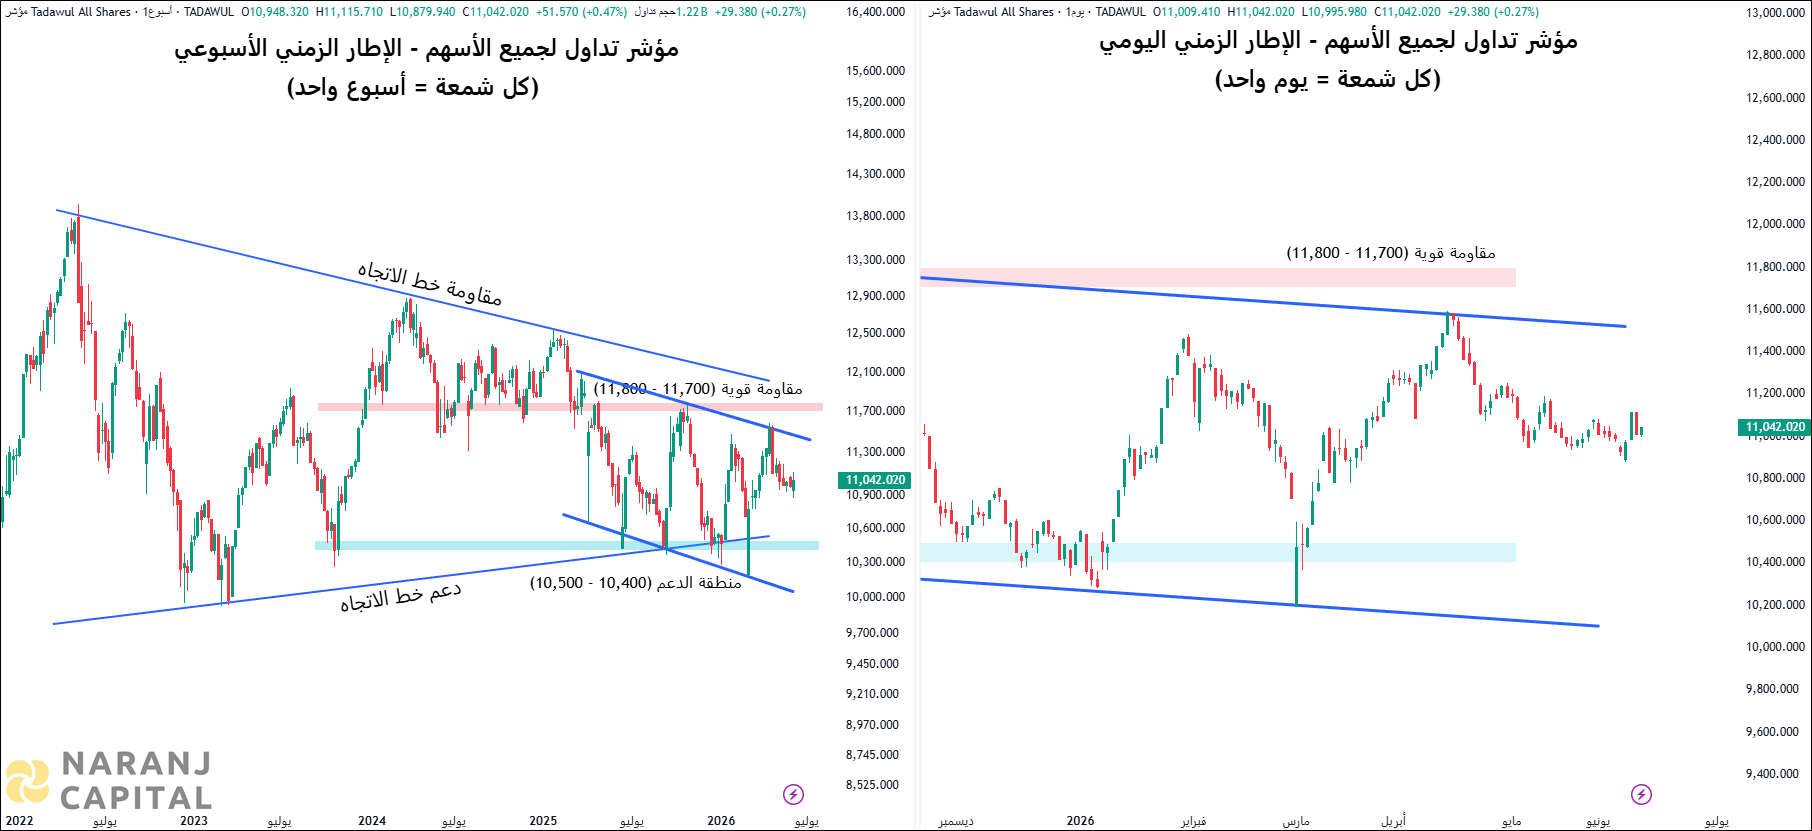
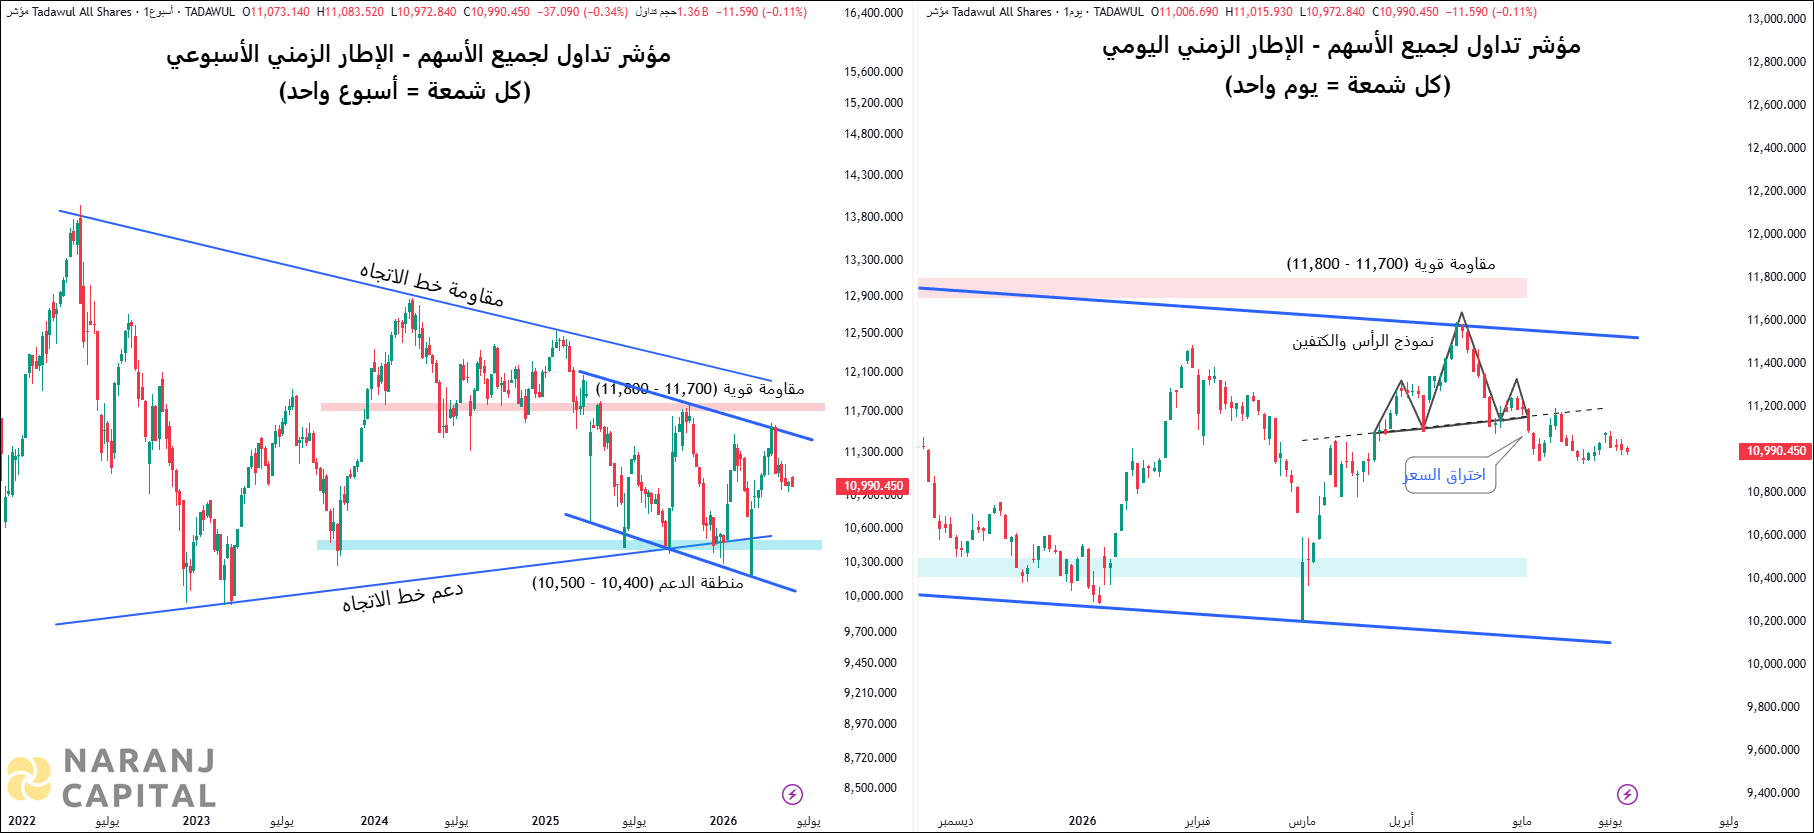
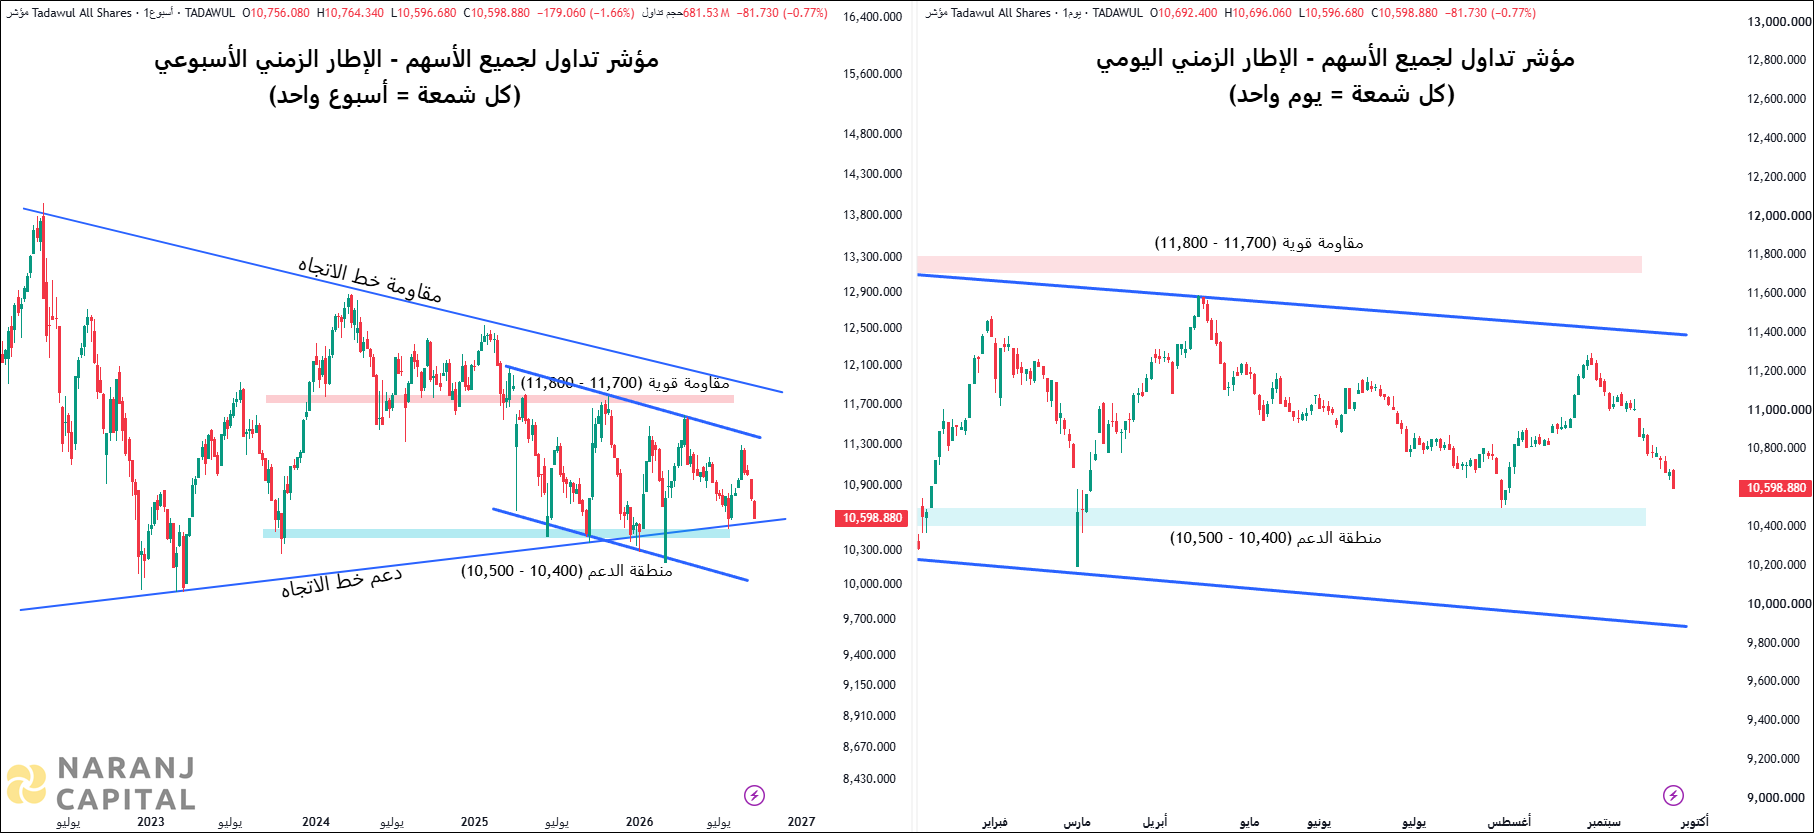
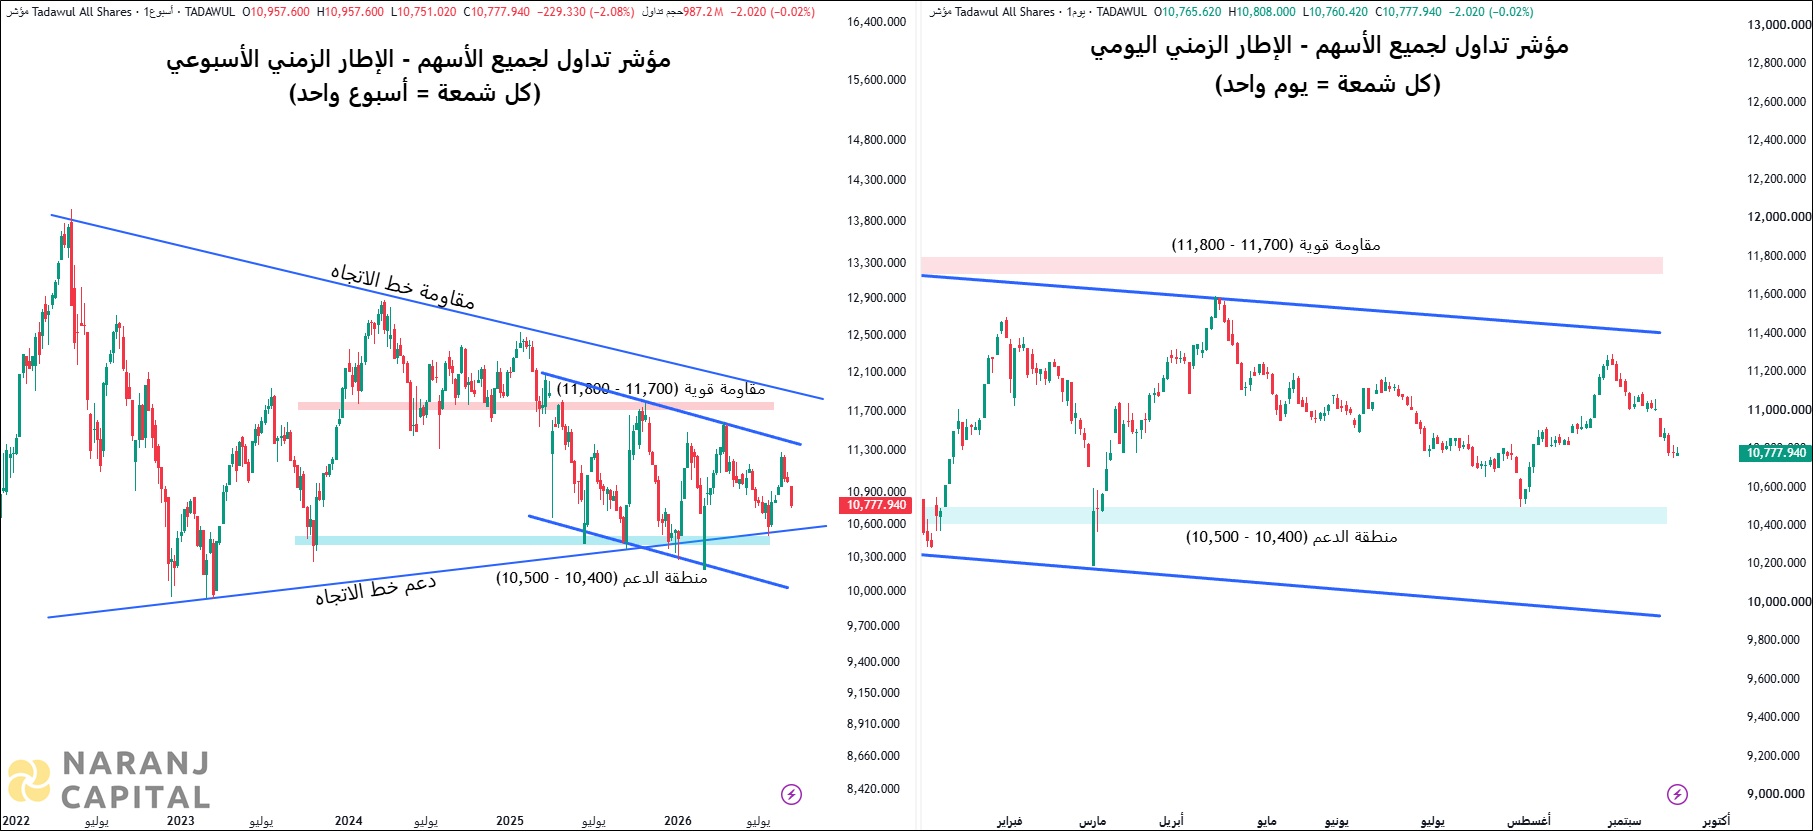
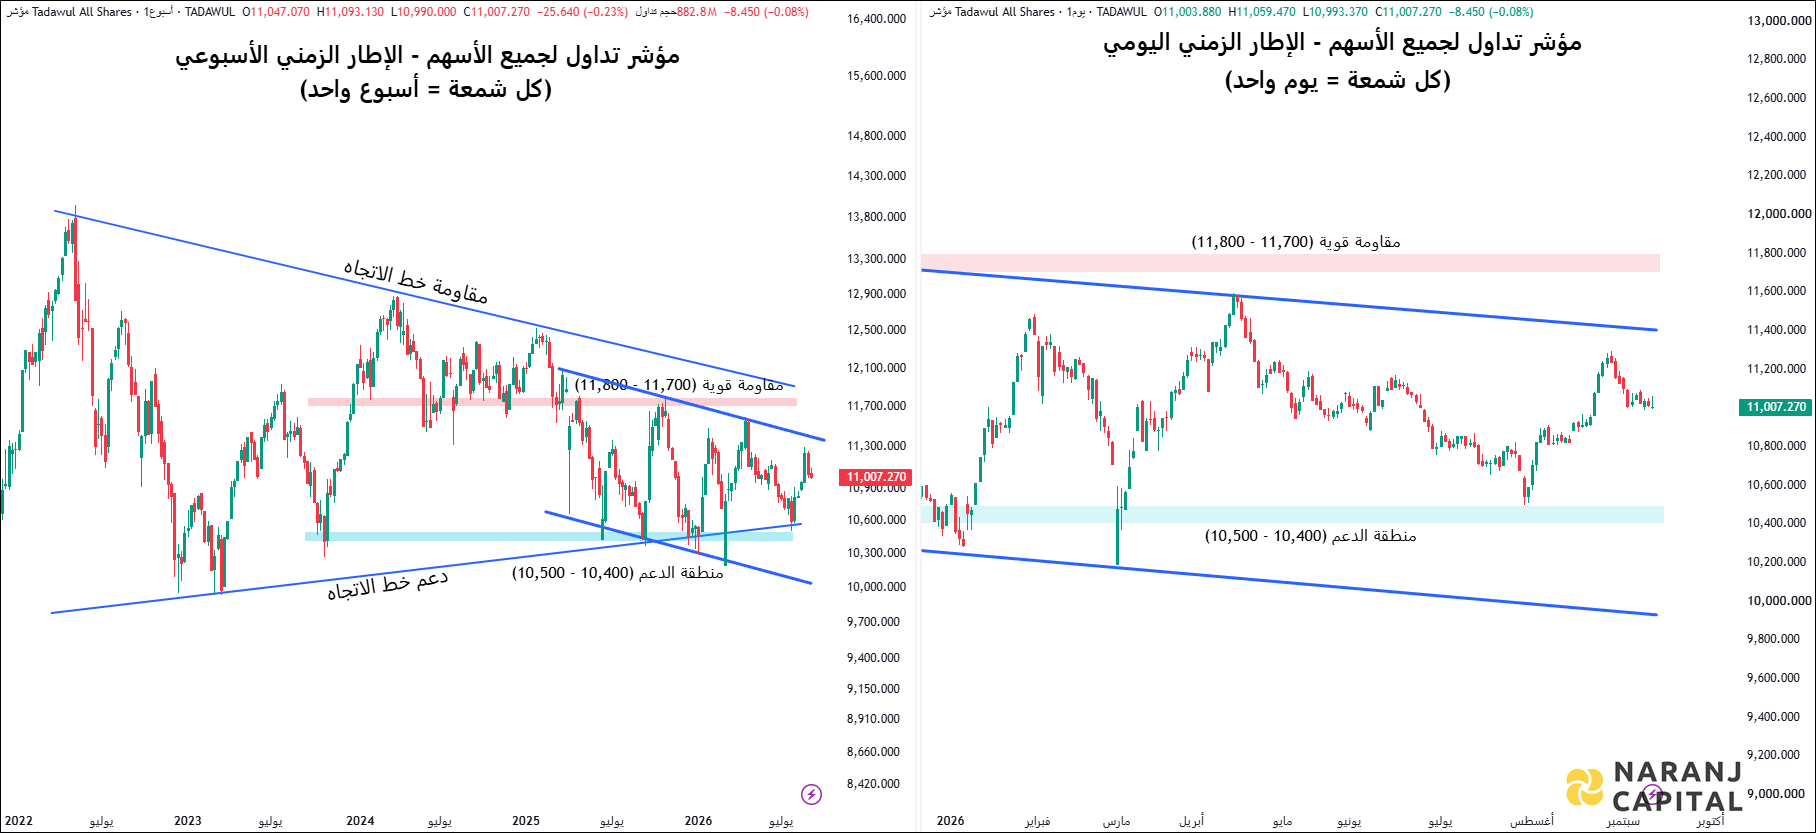
TASI has recently broken out of a downtrend parallel channel, potentially marking a significant turning point.
This development may ignite a rally, driving the index higher and signaling a shift in market sentiment.
Daily Chart Analysis
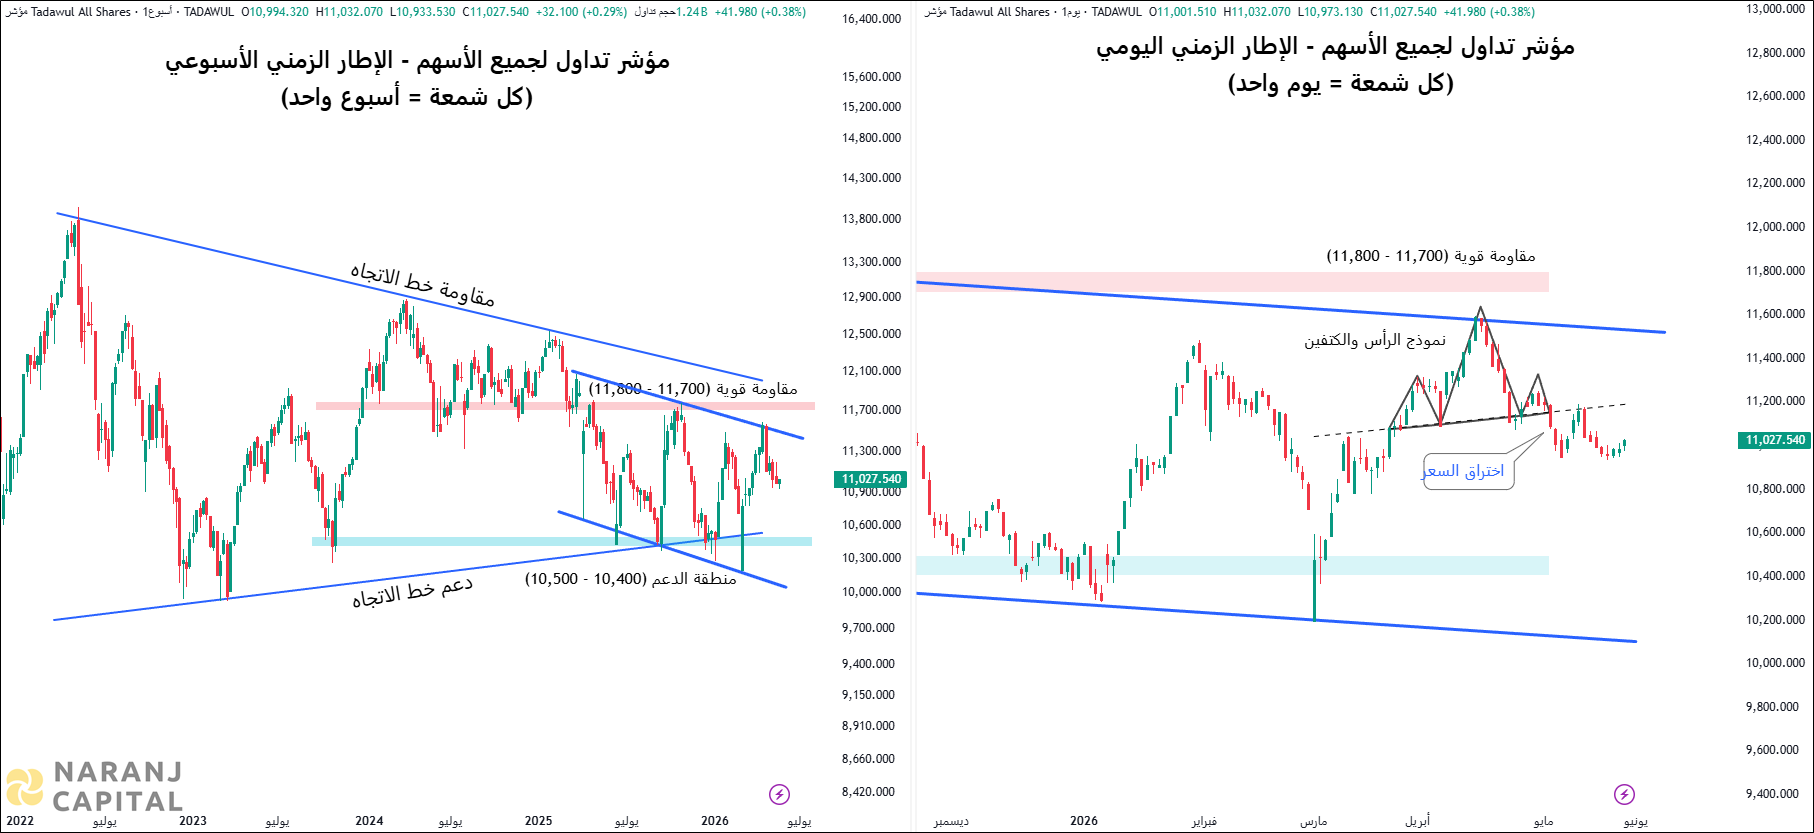
A prominent Inverted Head & Shoulder pattern has emerged on the daily chart, indicating a potential trend reversal.
The recent breakout from this pattern has strengthened the likelihood of a reversal, suggesting that the index may be poised for a move higher.
Key Resistance Level
The immediate resistance level is situated at approximately 12,400. A successful breach of this level could trigger a rally, with potential upside momentum.
Share with
00votes
Article Rating
Subscribe
0 Comments
Join Our Telegram Channel for Saudi Stock Market Update