- Naranj Research Desk

- 🇸🇦 Saudi Stock Market
- 🇺🇸 USA Stock Market


4% – 5%
12 - 14 Days
4% – 5%
12 - 14 Days
| Metric | Q1 FY26 (Mar '26) | Q4 FY25 (Dec '25) | Q1 FY25 (Mar '25) | QoQ Change | YoY Change |
|---|---|---|---|---|---|
| Total Net Revenues | $1,067 M | $1,283 M | $927 M | ▼ 16.8% | ▲ 15.1% |
| Adjusted EBITDA (non-GAAP) | $534 M | $761 M | $470 M | ▼ 29.8% | ▲ 13.6% |
| Adjusted EBITDA Margin | 50.00% | 59.30% | 50.70% | ▼ 930 bps | ▼ 70 bps |
| Net Income (GAAP) | $346 M | $605 M | $336 M | ▼ 42.8% | ▲ 3.0% |
| Net Margin (GAAP) | 32.40% | 47.20% | 36.20% | ▼ 1,480 bps | ▼ 380 bps |
| Diluted EPS (GAAP) | $0.38 | $0.66 | $0.37 | ▼ 42.4% | ▲ 2.7% |
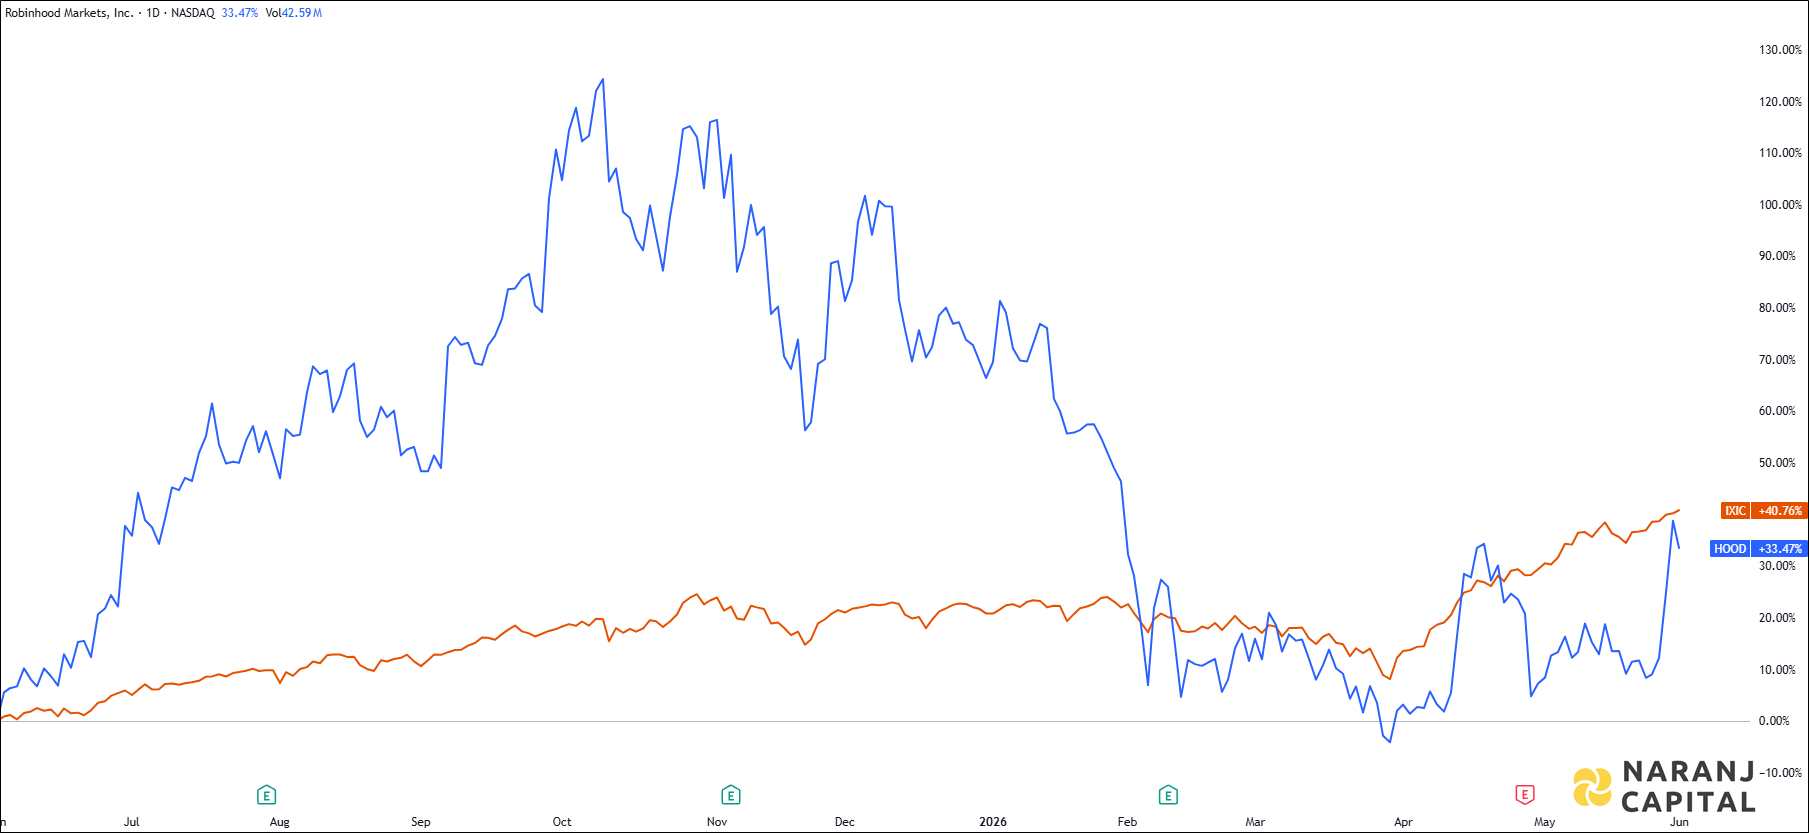
HOOD — NASDAQ —
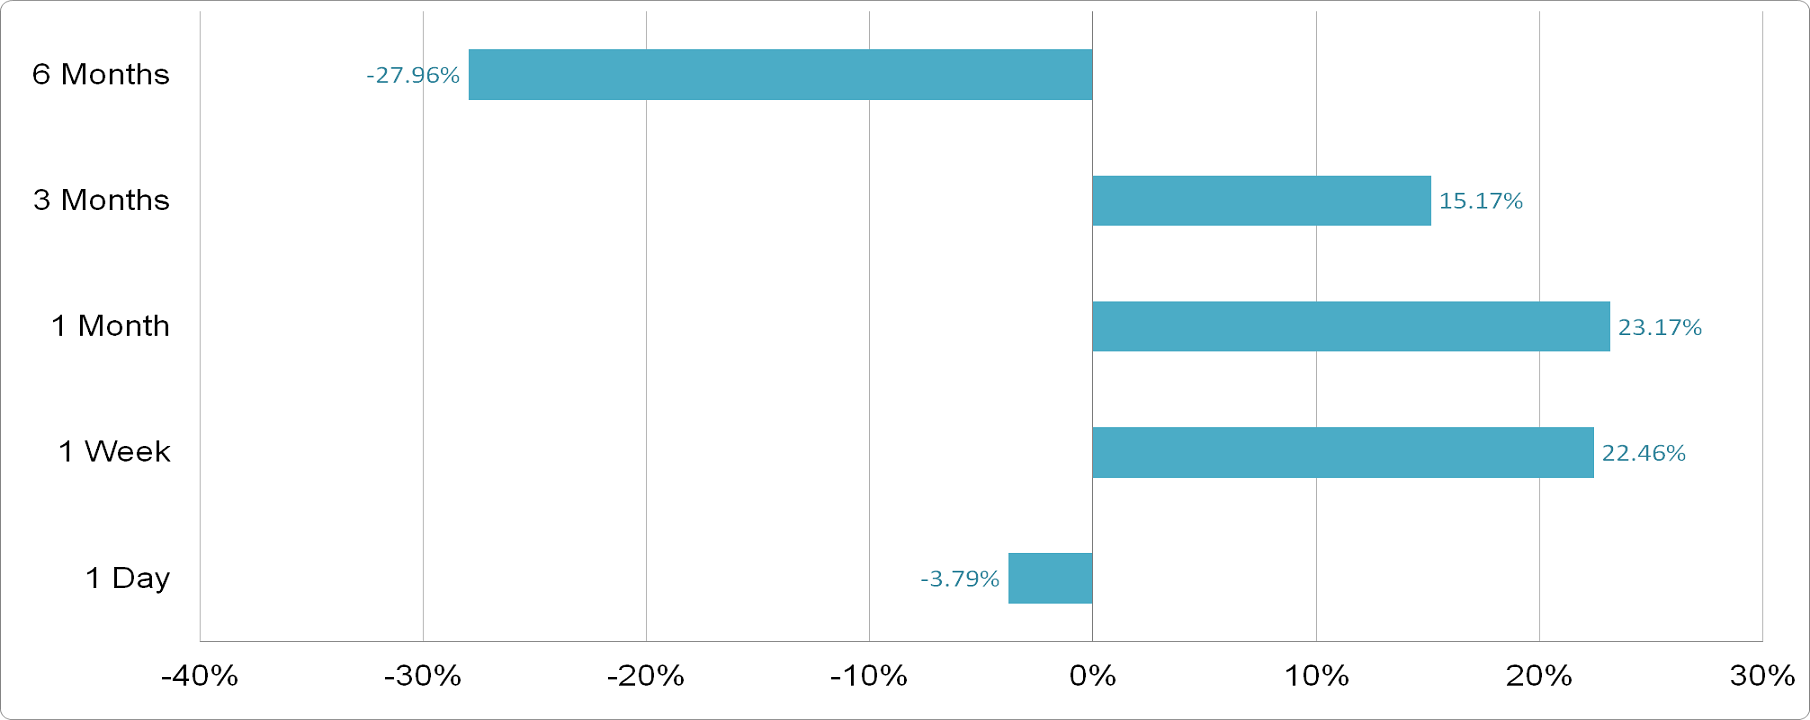
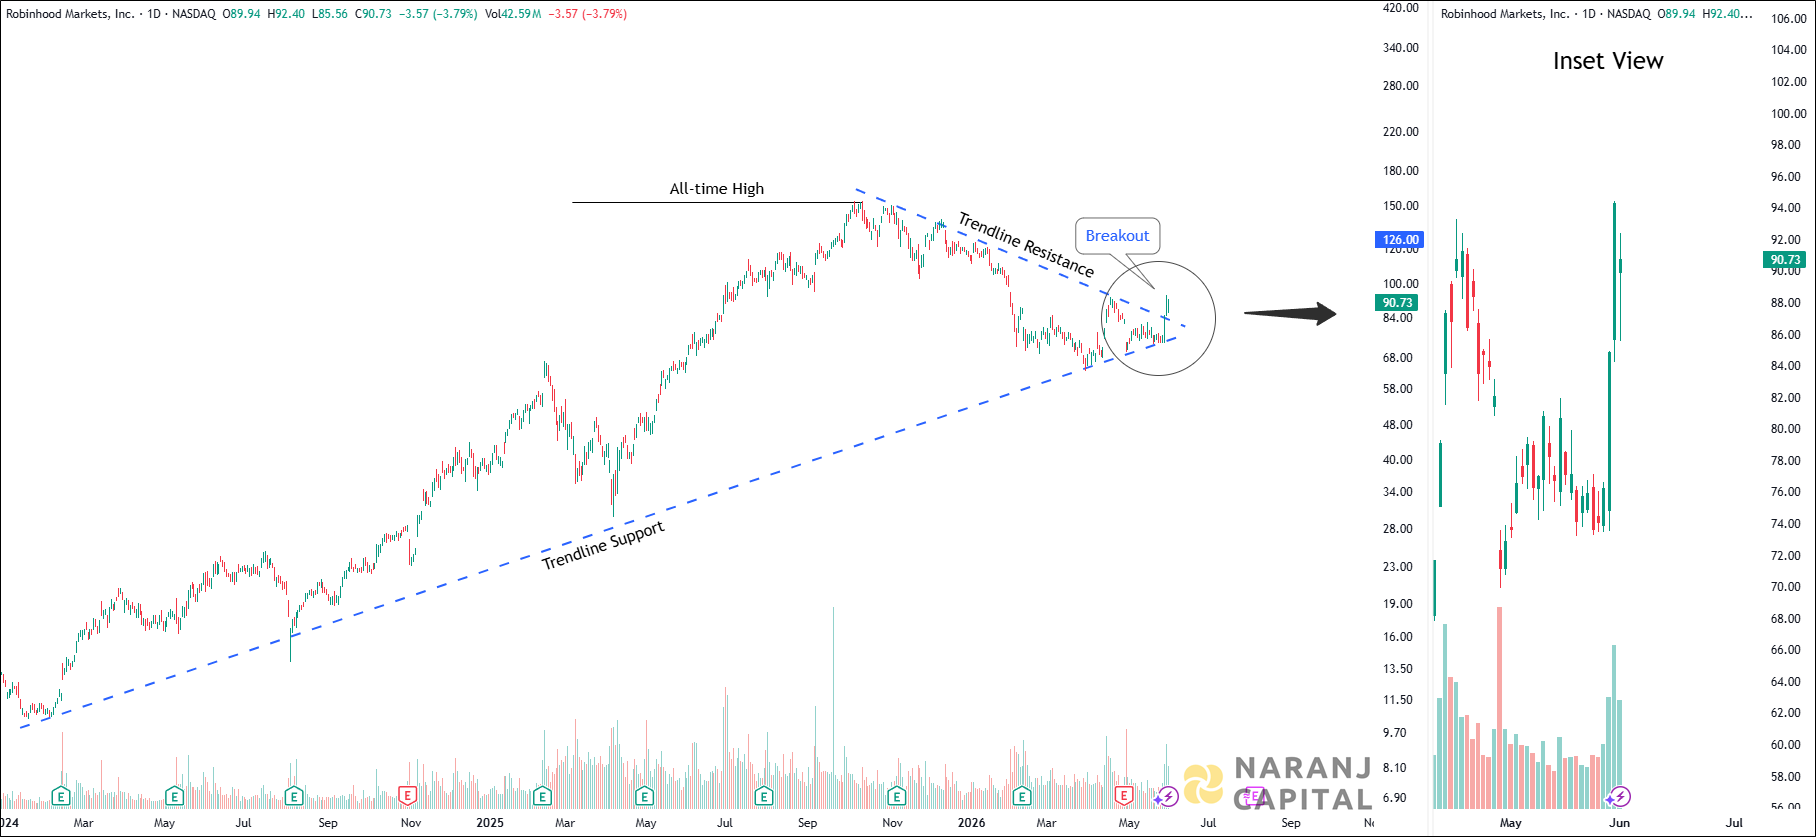
| Indicator | Value | Zone |
|---|---|---|
| RSI-14 | 63.50 | Neutal |
| CCI-14 | 222.75 | Overbought |
| ROC | 12.32 | Positive |
| Stochastic RSI | 77.90 | Overbought |
| William %R | -17.30 | Overbought |
| EMA | Value | Stock Position |
|---|---|---|
| 5 EMA | 86.05 | Above |
| 10 EMA | 82.44 | Above |
| 20 EMA | 80.39 | Above |
| 50 EMA | 80.03 | Above |
| 100 EMA | 85.98 | Above |
| 200 EMA | 88.02 | Above |
Based on our short term trading ideas in USA stocks, Robinhood Markets stock price target will be USD 94 - USD 95 in the next 12-14 trading sessions.





4% – 5%
12 - 14 Days
4% – 5%
12 - 14 Days
| Metric | Q1 FY26 (Mar '26) | Q4 FY25 (Dec '25) | Q1 FY25 (Mar '25) | QoQ Change | YoY Change |
|---|---|---|---|---|---|
| Total Net Revenues | $1,067 M | $1,283 M | $927 M | ▼ 16.8% | ▲ 15.1% |
| Adjusted EBITDA (non-GAAP) | $534 M | $761 M | $470 M | ▼ 29.8% | ▲ 13.6% |
| Adjusted EBITDA Margin | 50.00% | 59.30% | 50.70% | ▼ 930 bps | ▼ 70 bps |
| Net Income (GAAP) | $346 M | $605 M | $336 M | ▼ 42.8% | ▲ 3.0% |
| Net Margin (GAAP) | 32.40% | 47.20% | 36.20% | ▼ 1,480 bps | ▼ 380 bps |
| Diluted EPS (GAAP) | $0.38 | $0.66 | $0.37 | ▼ 42.4% | ▲ 2.7% |
HOOD — NASDAQ —
| Indicator | Value | Zone |
|---|---|---|
| RSI-14 | 63.50 | Neutal |
| CCI-14 | 222.75 | Overbought |
| ROC | 12.32 | Positive |
| Stochastic RSI | 77.90 | Overbought |
| William %R | -17.30 | Overbought |
| EMA | Value | Stock Position |
|---|---|---|
| 5 EMA | 86.05 | Above |
| 10 EMA | 82.44 | Above |
| 20 EMA | 80.39 | Above |
| 50 EMA | 80.03 | Above |
| 100 EMA | 85.98 | Above |
| 200 EMA | 88.02 | Above |
Based on our short term trading ideas in USA stocks, Robinhood Markets stock price target will be USD 94 - USD 95 in the next 12-14 trading sessions.