- Naranj Research Desk
- 🇸🇦 Saudi Stock Market
- 🇺🇸 USA Stock Market


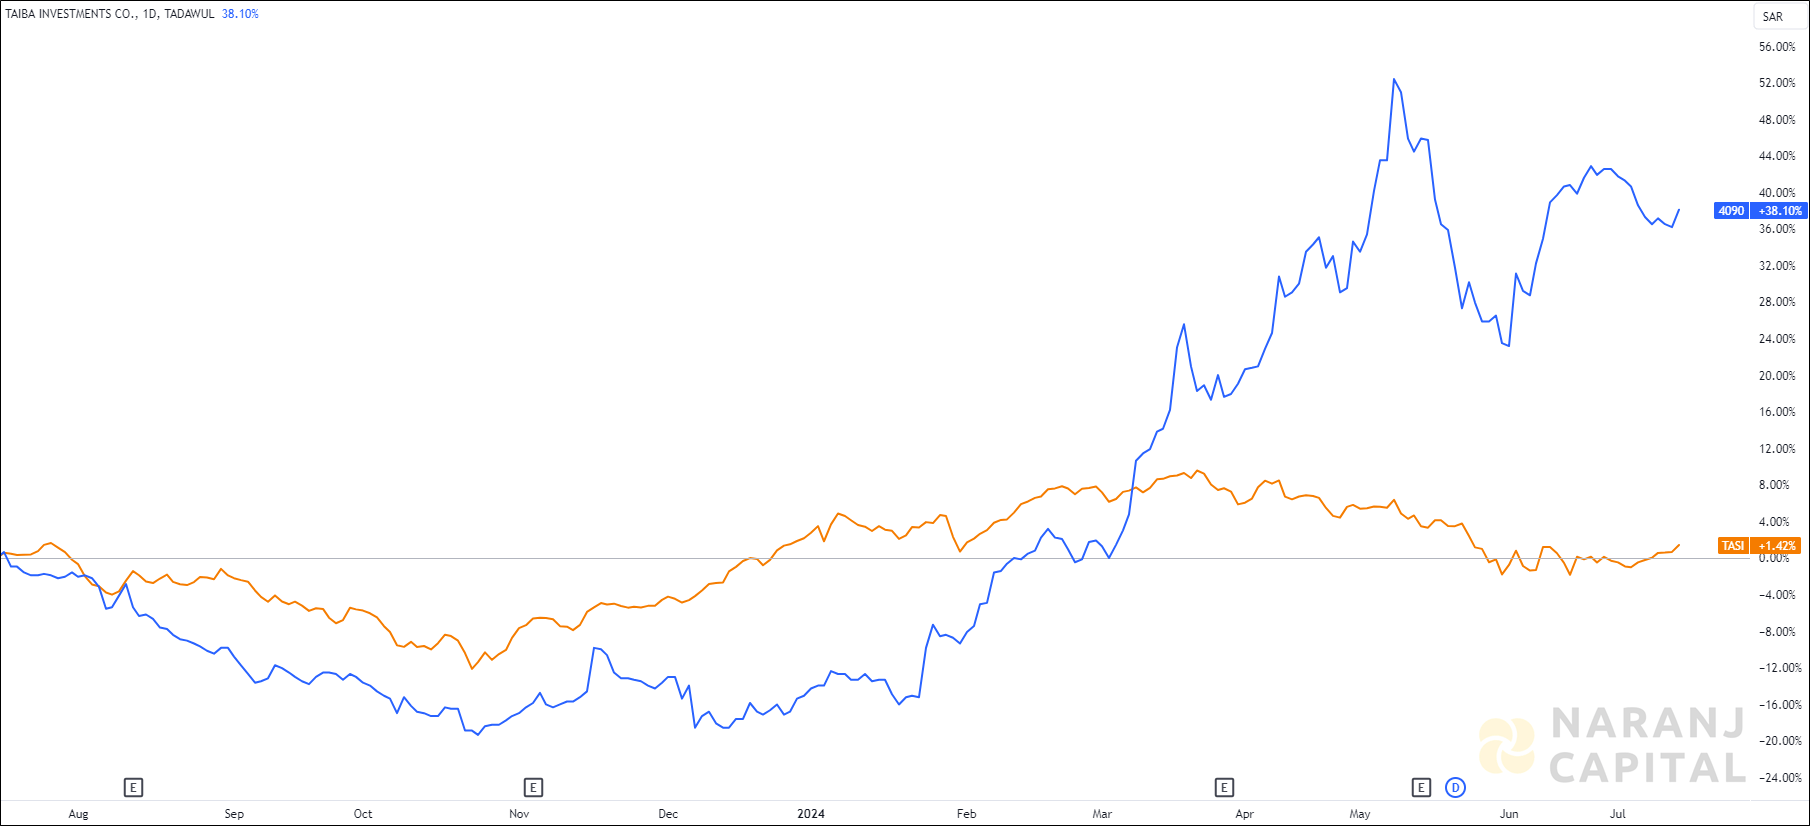
TAIBA — TASI —
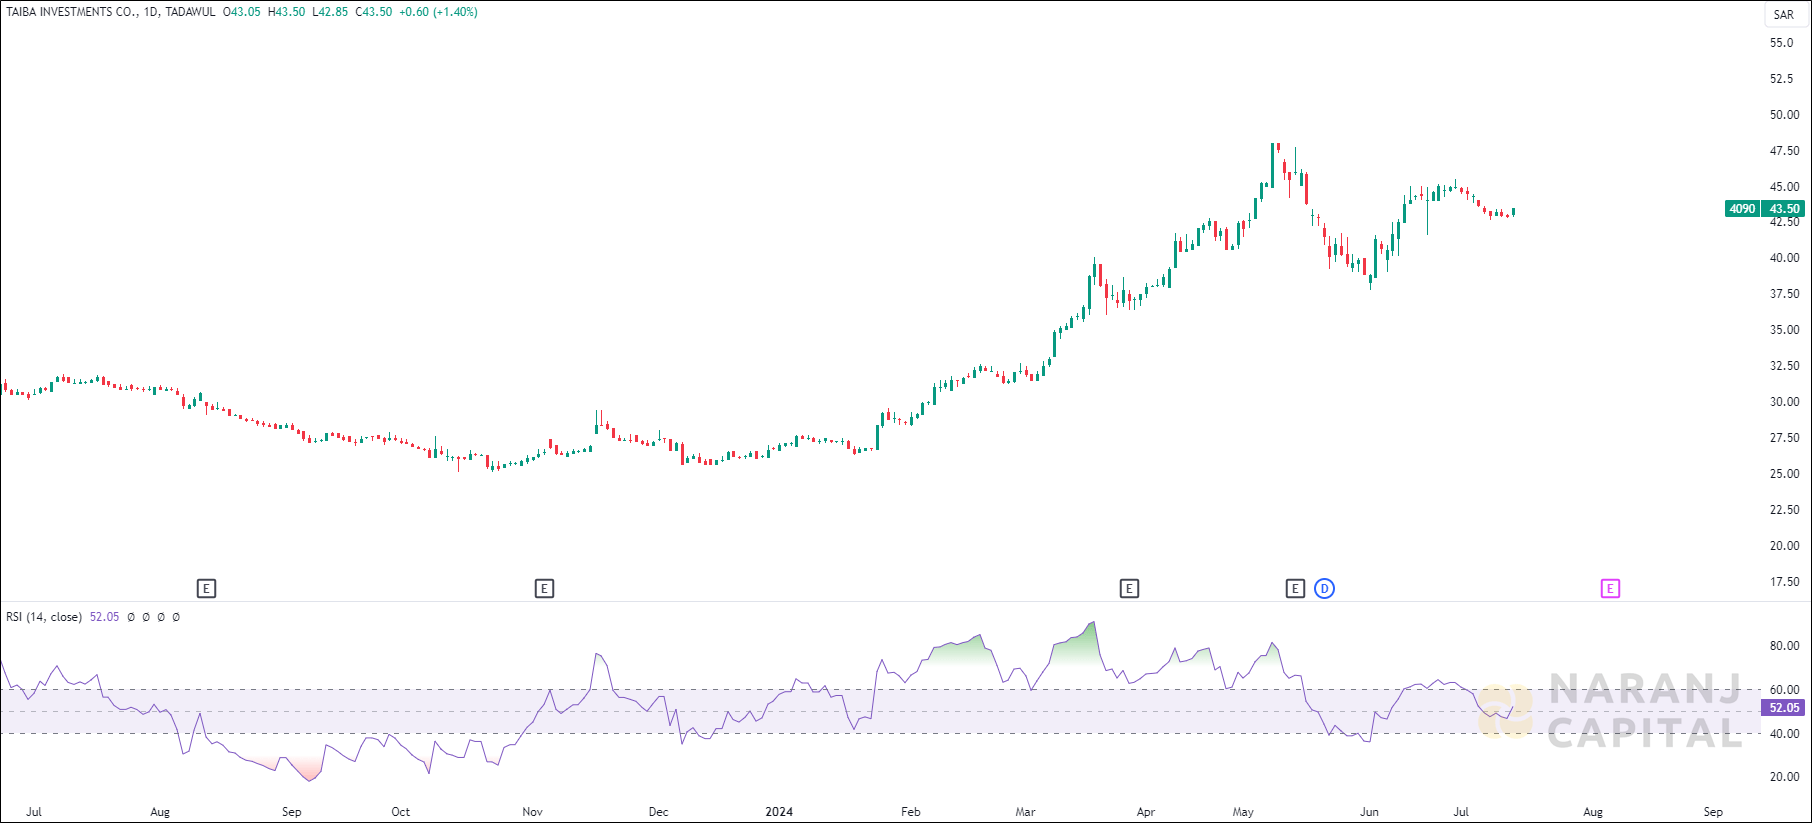
The stock's current RSI is 52.05, and the upward trend of the RSI line indicates the strength of buyers.
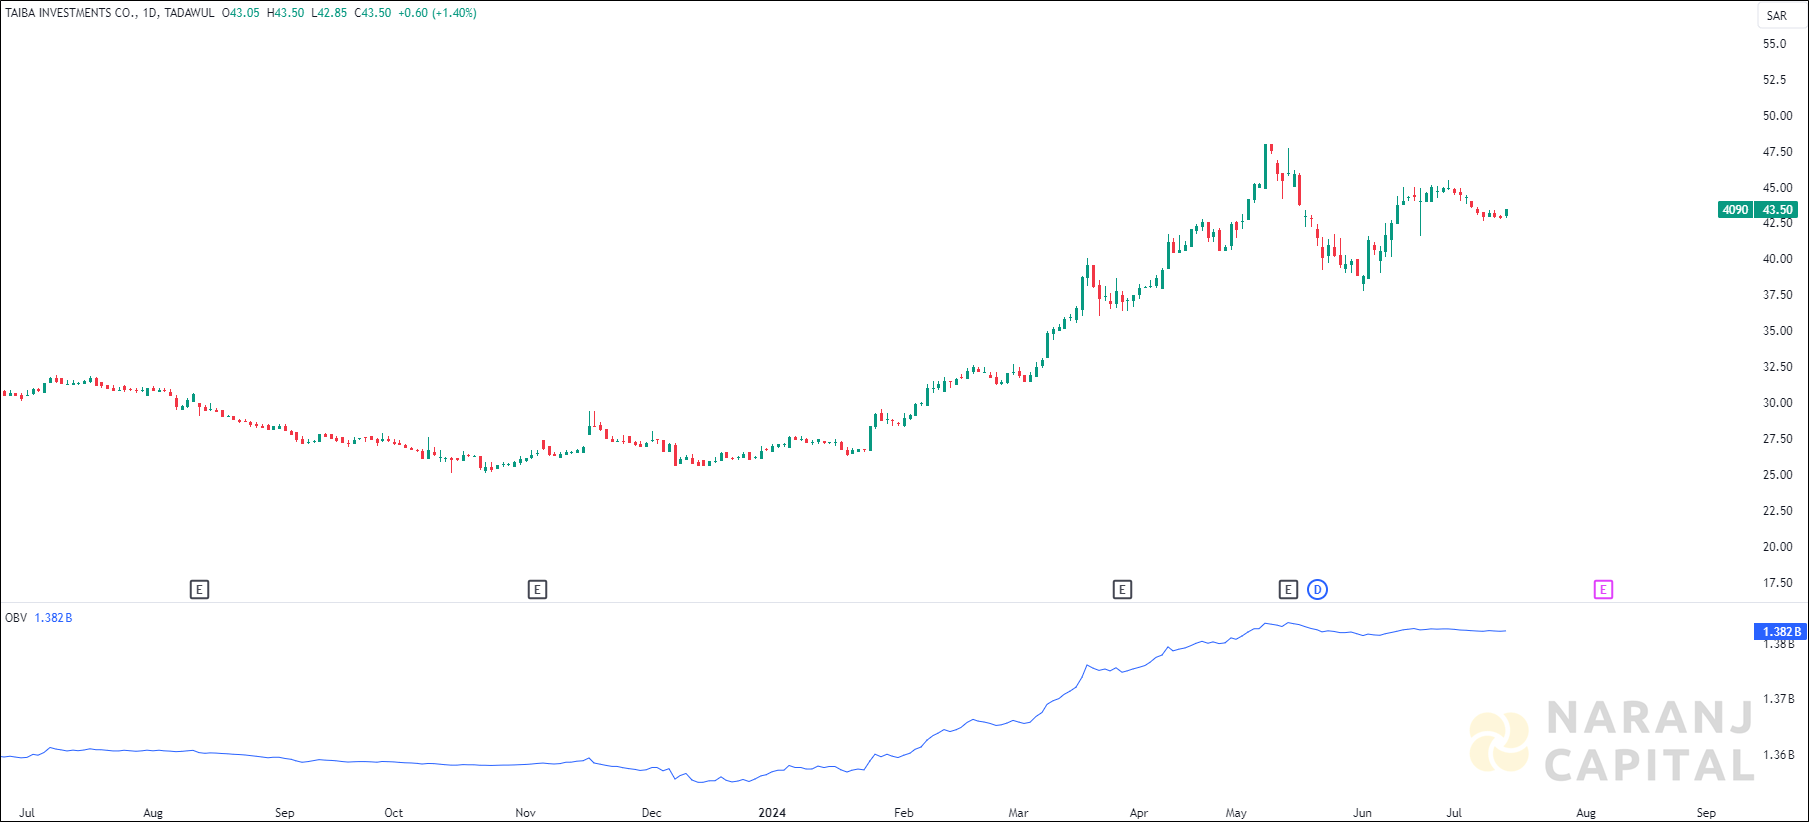
The OBV line is moving in the same upward direction which means there is a positive sentiment in the market. Also the significant price up move accompanying with increasing OBV volume suggests strong buying pressure.
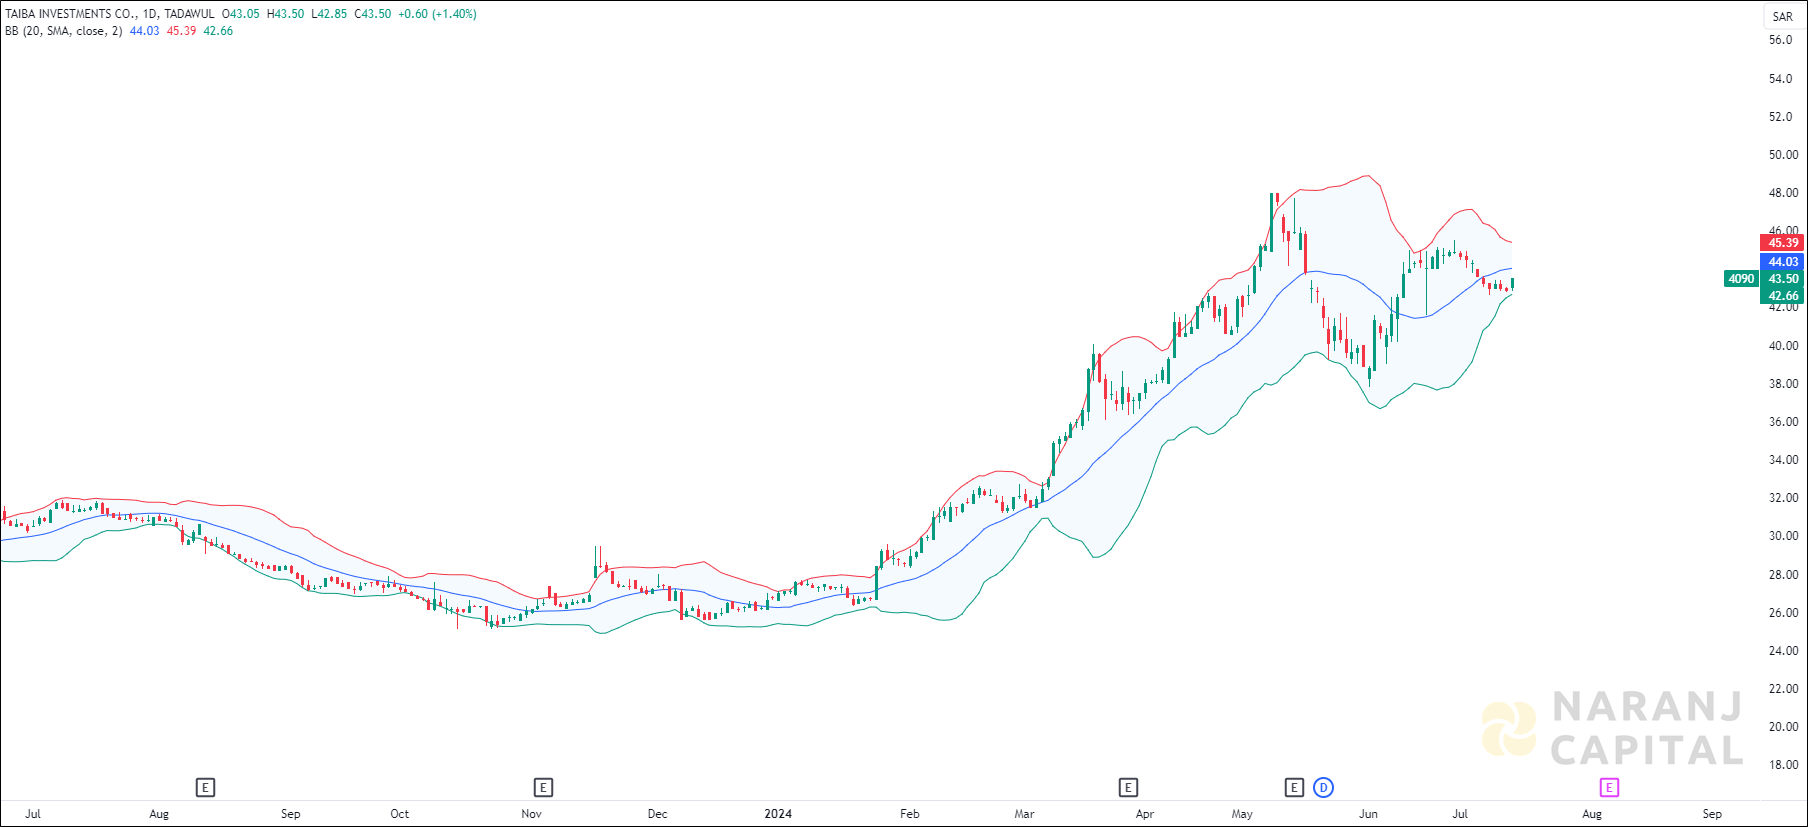
The Price bounced when it touched the lower band and moving upside.
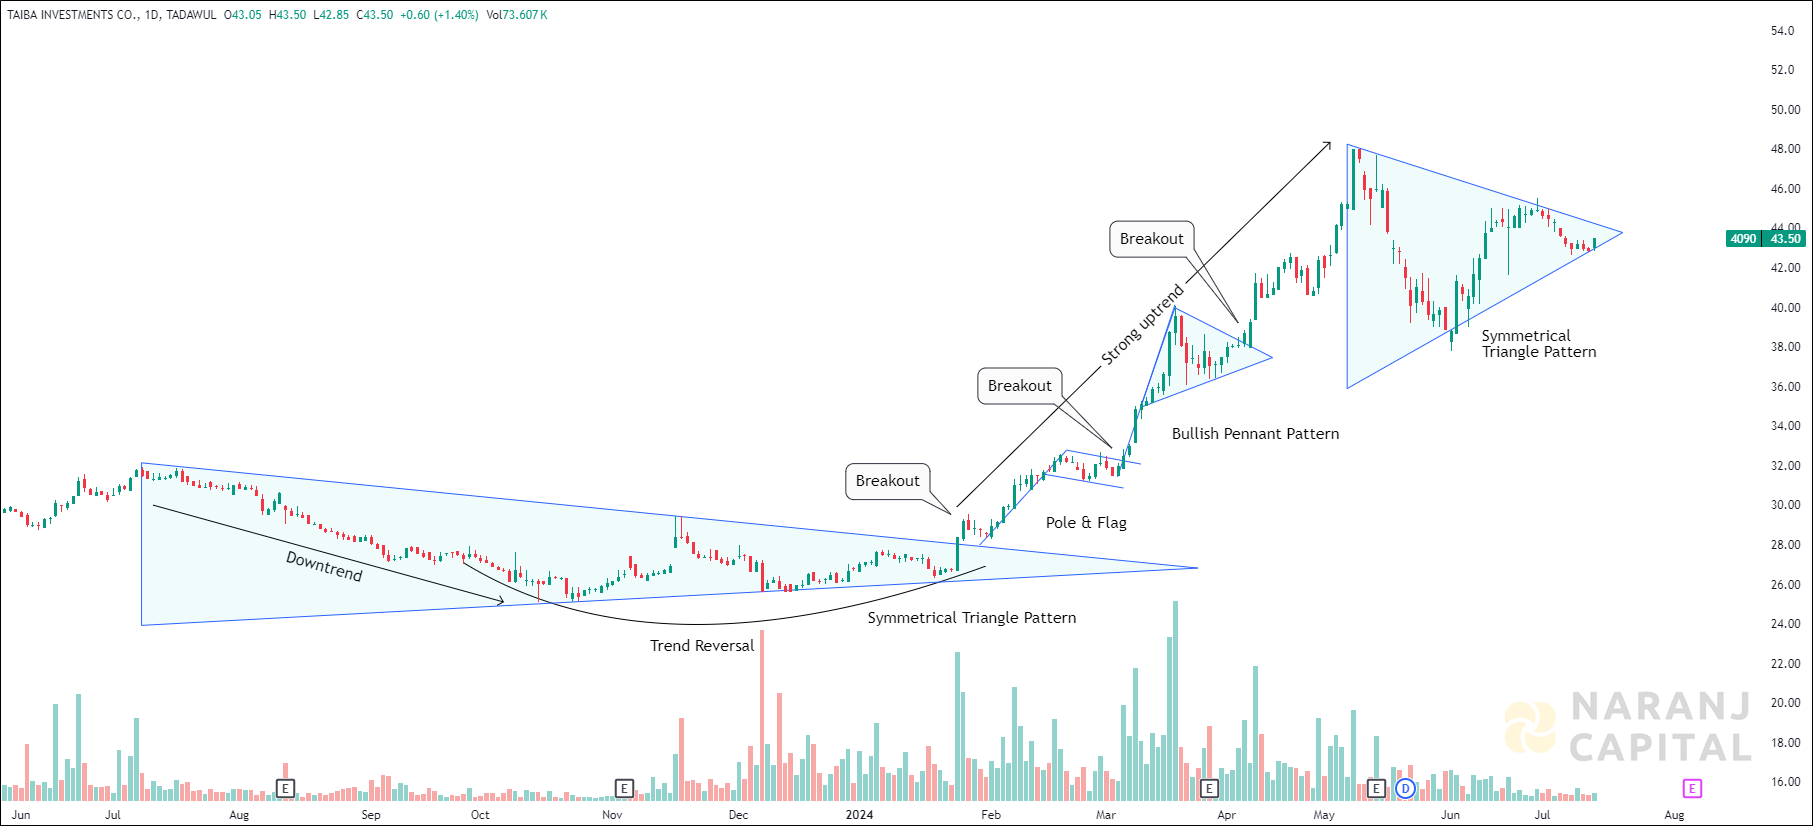
Based on our trade advice for Saudi Tadawul, Taiba Investments stock price target will be SAR 45 - SAR 45.5 in the next 12-14 trading sessions.