- Naranj Research Desk
- 🇸🇦 Saudi Stock Market
- 🇺🇸 USA Stock Market


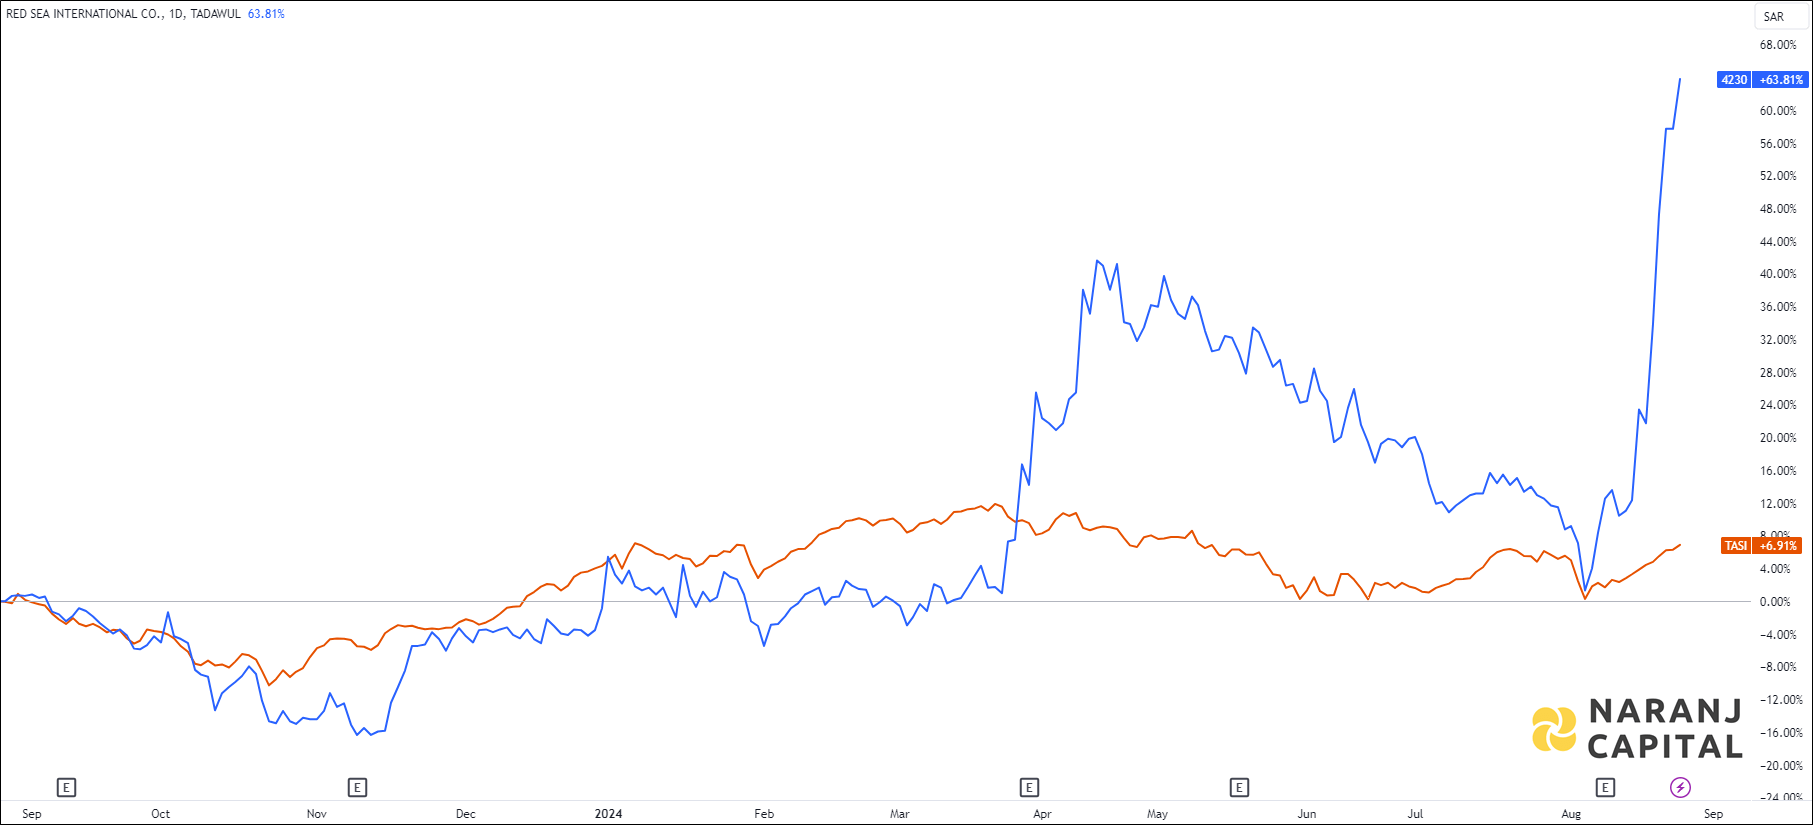
RED SEA — TASI —
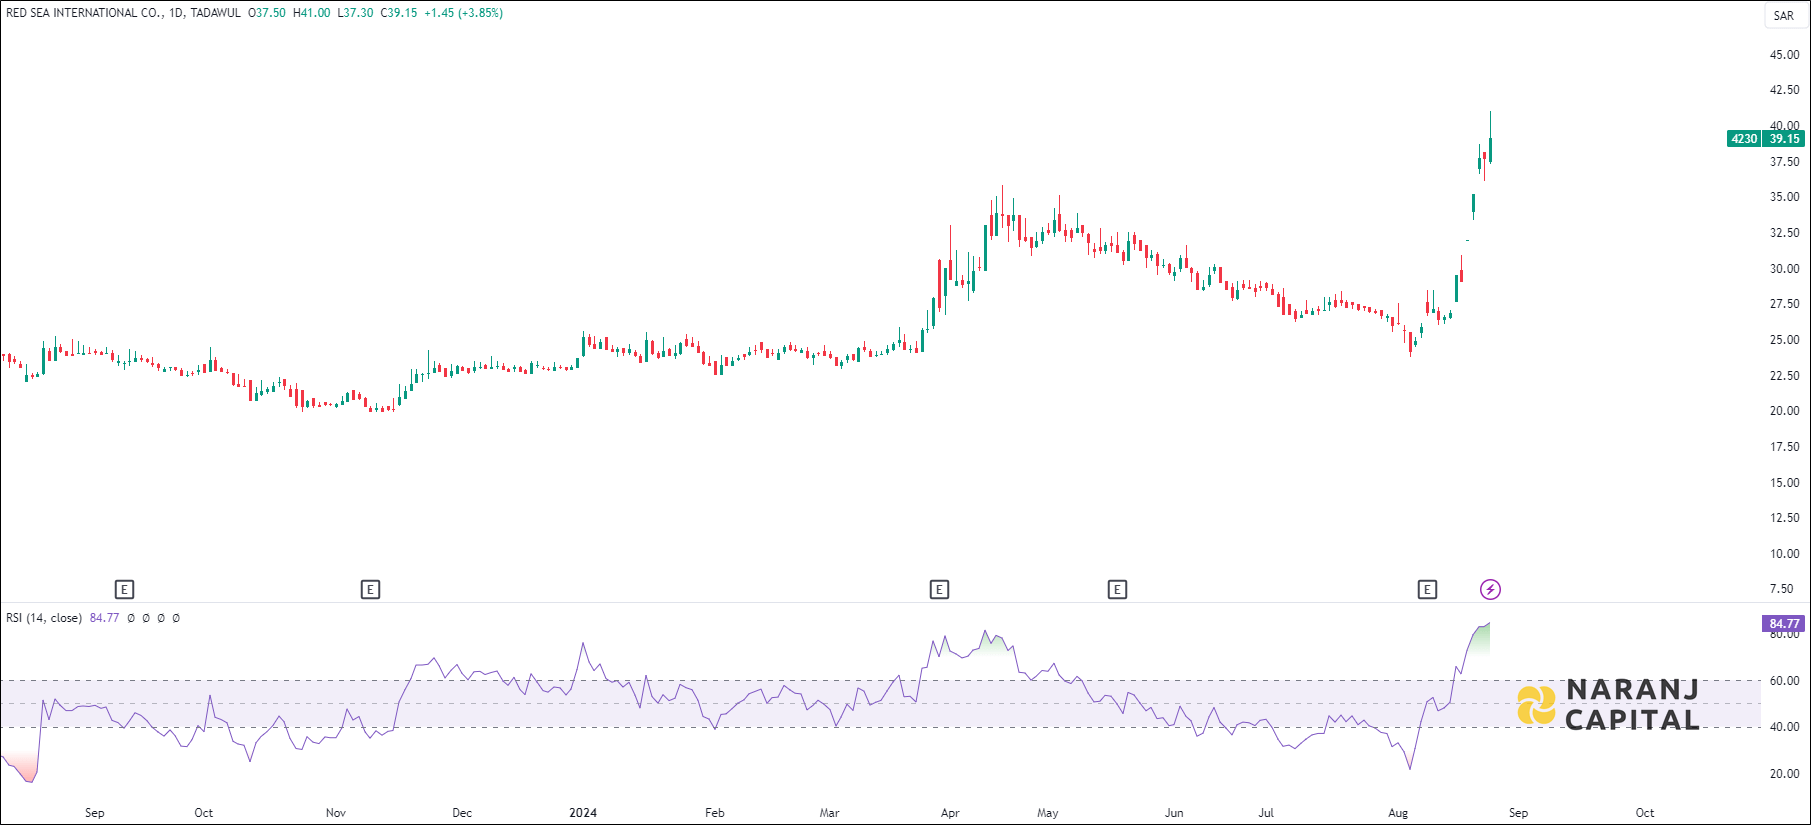
Current RSI of this stock is 84.77, which indicates the strength of buyers.
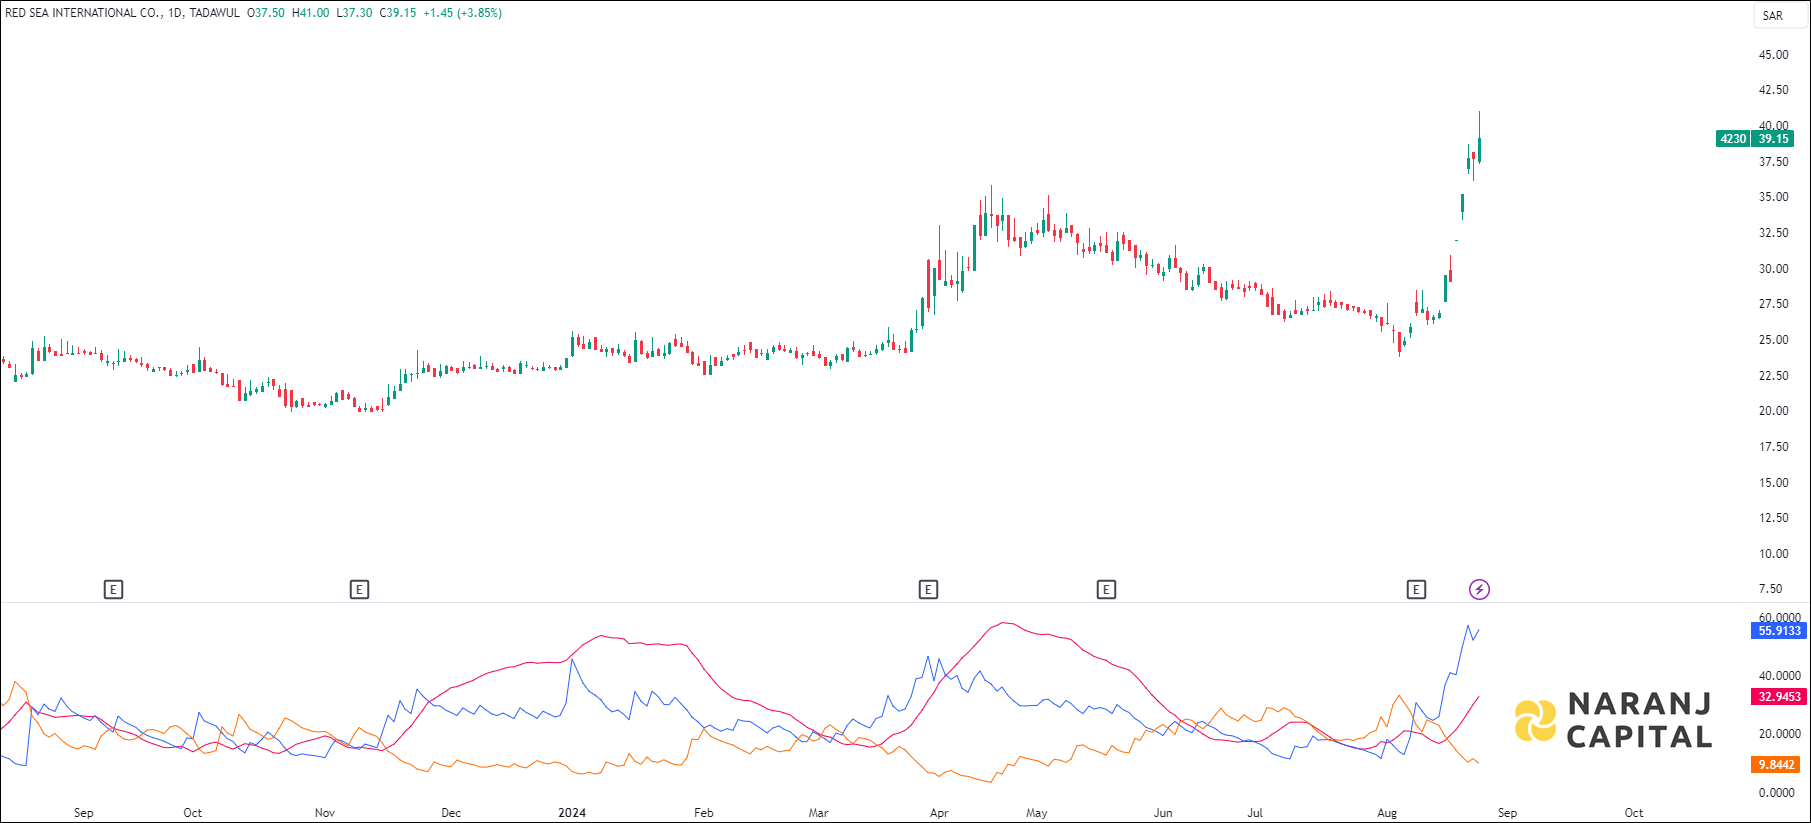
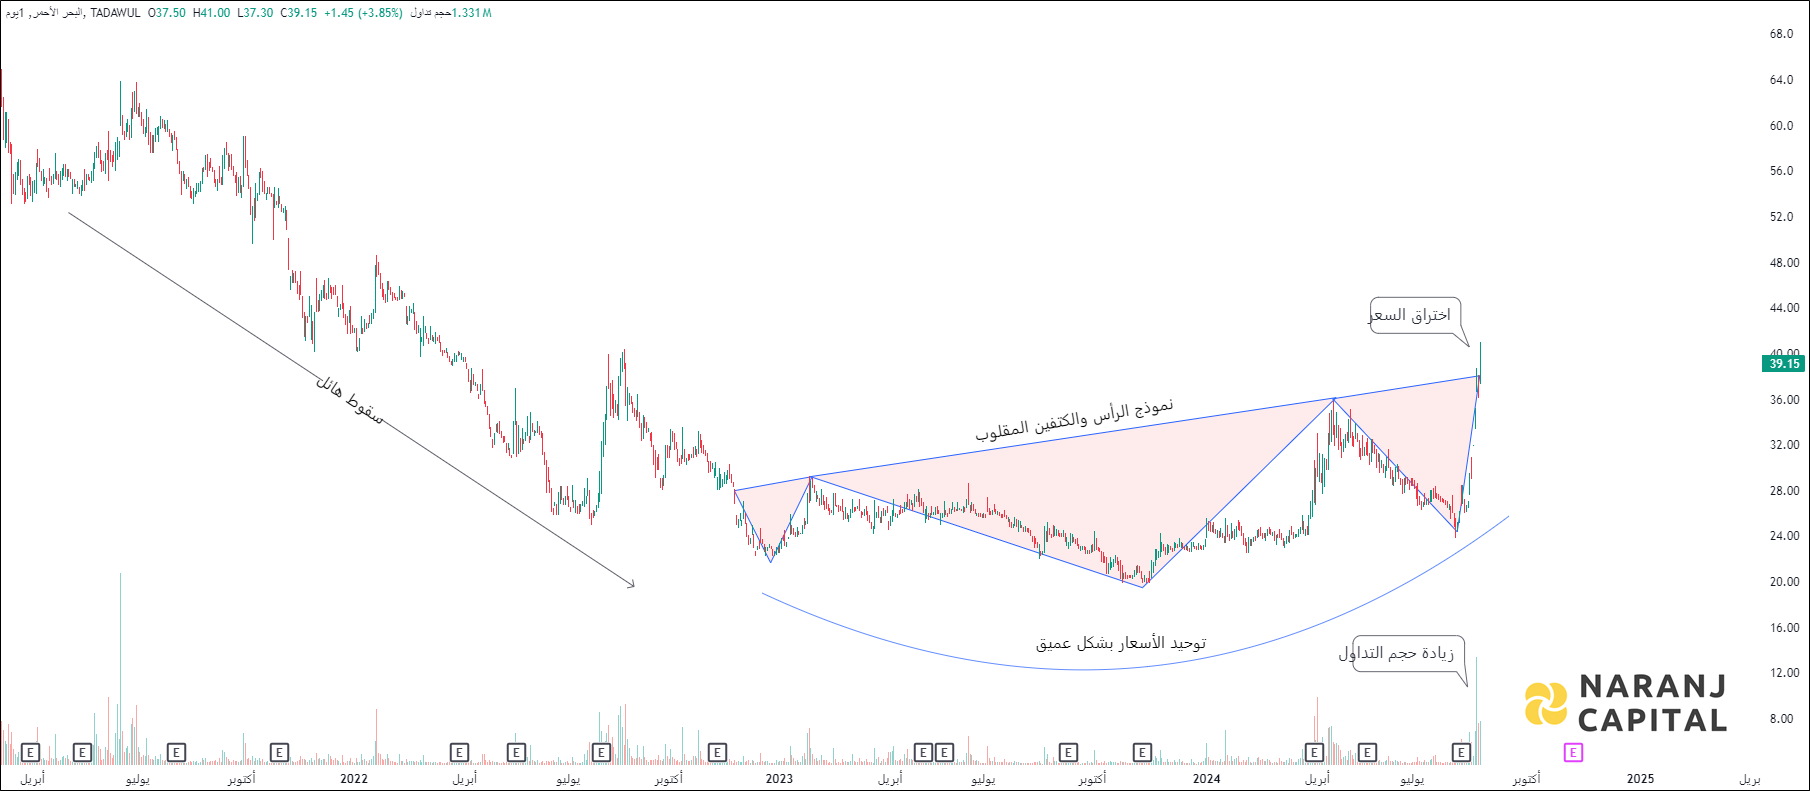
Increasing ADX value above 20, indicated the strength of the trend, thereby uptrending ADX confirms the bullish or bearish supportive decisions. Along with the rising ADX, and the +DI is above (or crossing) -DI, indicates the long trades should be favoured.
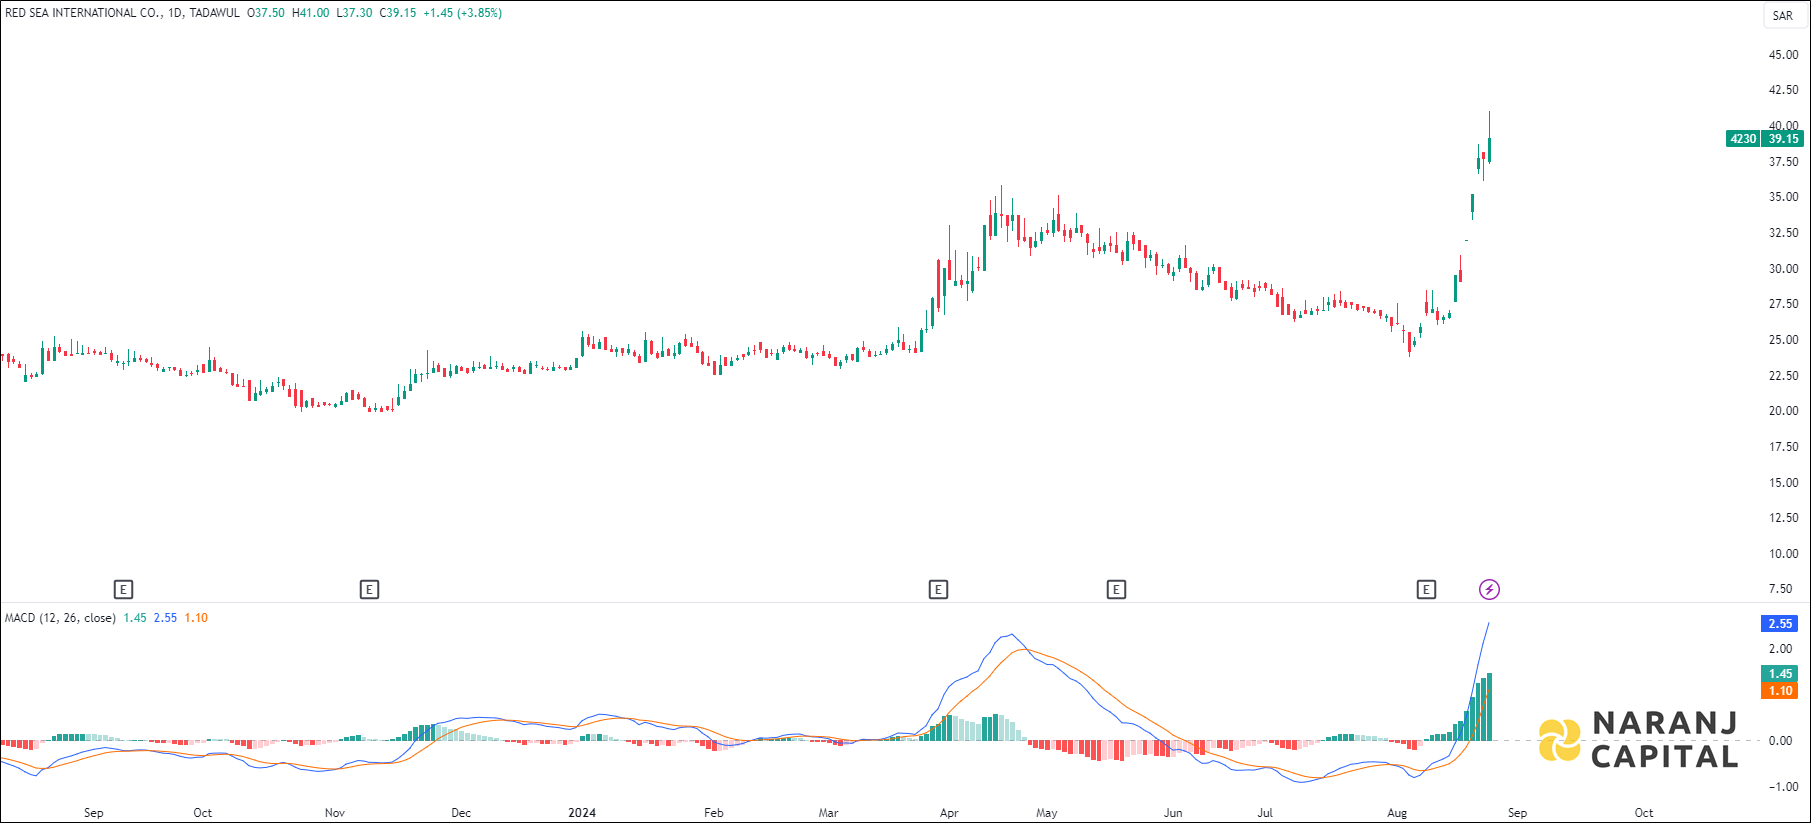
MACD line has crossed the signal line from the below, generates bullish signal.
Our analysis suggests Red Sea International could reach SAR 42.5 to SAR 44 within 12-14 trading sessions, providing a chance to profit by trading KSA stocks.