
Introduction
Your portfolio just dropped 12% in a few weeks. Is this a healthy pause before stocks climb higher, or the first chapter of a much longer, scarier story? Knowing the difference between a correction and a bear market won't stop the drop, but it can completely change how you react to it.
For investors following US short term delivery based trading, understanding whether a decline is a temporary correction or the beginning of a deeper downtrend can be especially important.
What Is a Market Correction, Really?
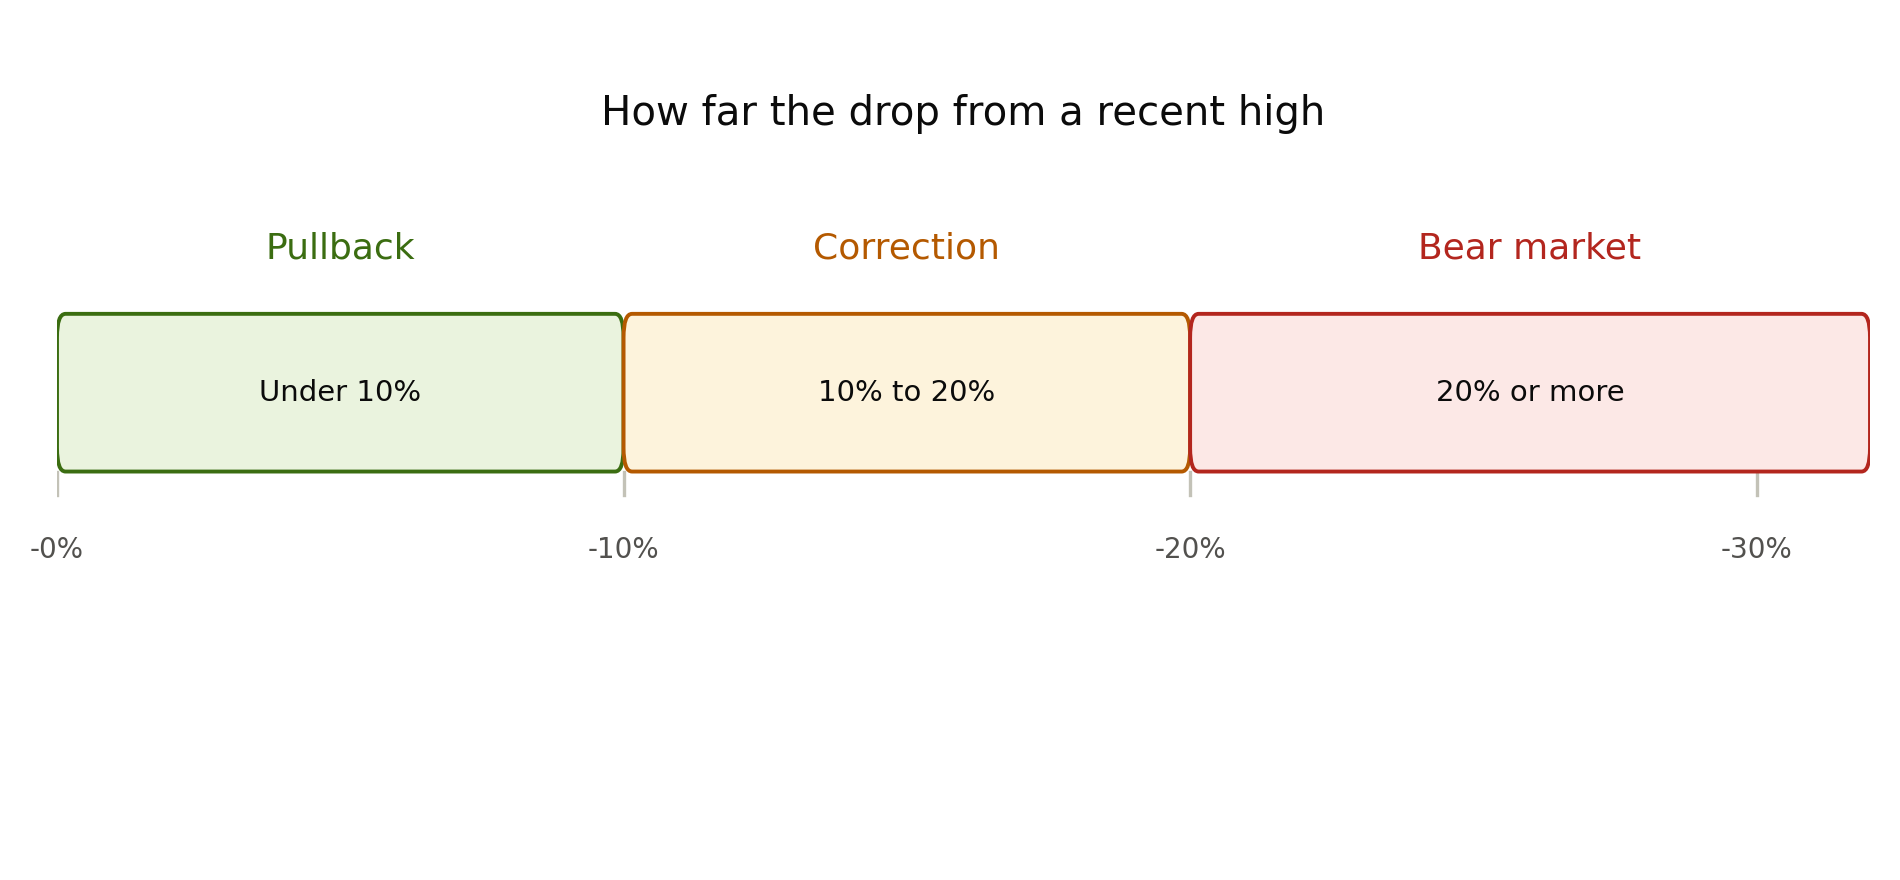
A market correction is a drop of 10% or more from a recent high, but less than 20%. It's the market's way of letting off steam after running too hot, too fast.
Think of a sprinter who's been running at full speed. Eventually, they need to slow down and catch their breath before continuing. A correction is that pause, uncomfortable, sometimes a little scary, but usually temporary.
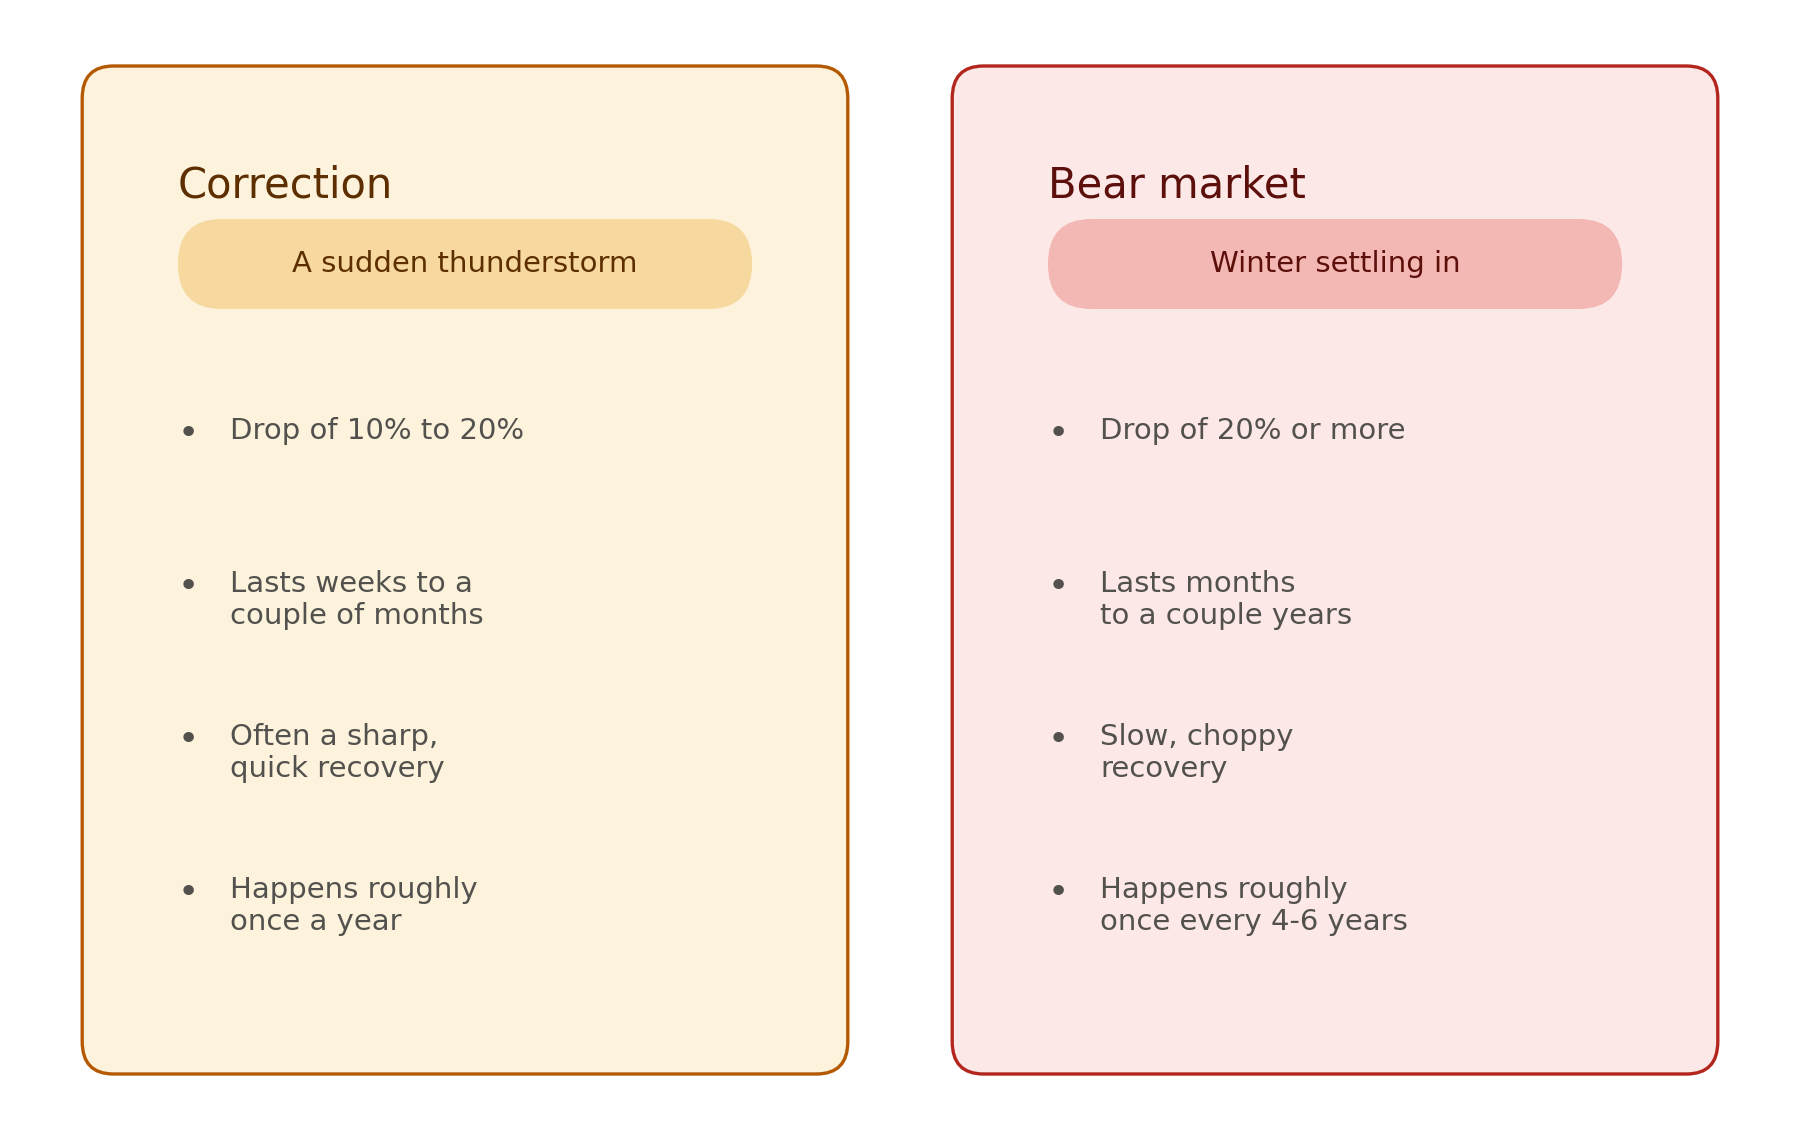
Corrections happen more often than most people think. Historically, the S&P 500 has dipped into correction territory roughly once a year on average. Most of the time, the market finds its footing again within a few weeks to a couple of months.
What Is a Bear Market, Really?
A bear market is a deeper, longer decline, a drop of 20% or more from a recent high. Unlike a correction's quick pause, a bear market is a genuine change in direction, often lasting many months, sometimes years.
If a correction is a sprinter catching their breath, a bear market is more like winter arriving. It doesn't reverse itself in a week. The whole season shifts, and it takes real time before conditions improve again.
Bear markets are usually tied to something bigger than short-term jitters, like a recession, a credit crunch, or a major shock to the economy. They show up far less often than corrections, roughly once every four to six years on average, but when they do, the damage and the recovery time both tend to be much larger.
Two Downturns, Two Very Different Stories
Let's imagine two market drops.
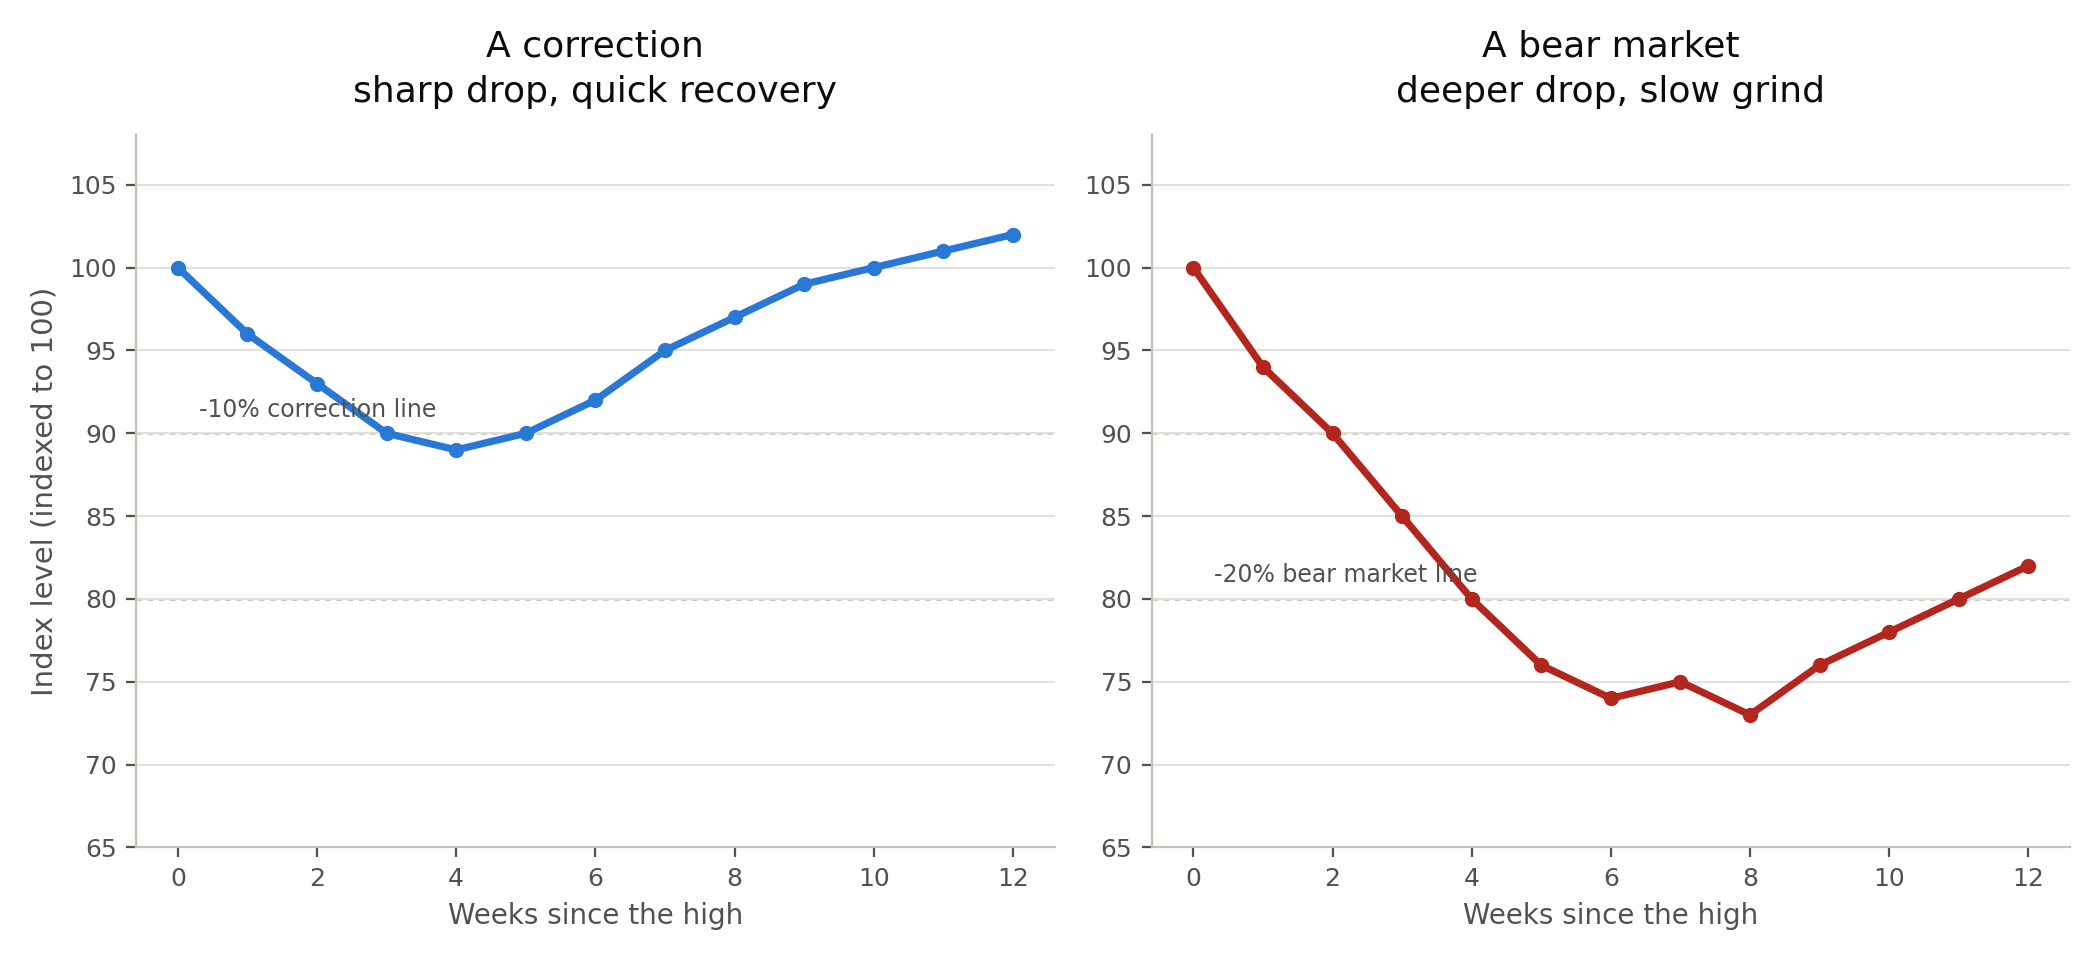
In the first, stocks fall 11% over three weeks after a wave of profit-taking following a strong rally. Corporate earnings are still solid, unemployment stays low, and within two months, the market has recovered most of its losses.
In the second, stocks fall 11% the same way, but this time, it keeps going. Corporate earnings start disappointing. Layoffs pick up. Credit gets harder to find. Six months later, the market is down 28% from its peak, and it takes over a year to fully recover.
Both started identically. Only one turned into a bear market.
| Signal | Correction | Bear Market |
|---|---|---|
| Typical decline | 10% to 20% | 20% or more |
| Typical duration | A few weeks to a couple months | Several months to a couple years |
| Usual cause | Short-term fear, profit-taking, one-off news | Recession, credit stress, deeper economic weakness |
| Recovery pattern | Often quick, a sharp V shape | Slow and choppy, sometimes with new lows |
| Company earnings | Usually still healthy | Often declining broadly |
Why the Difference Matters for Your Money
Here's the tricky part. In the moment, an 11% drop looks the same whether it's a correction or the early days of a bear market. That uncertainty is exactly what trips investors up, and it's why so many people end up making the wrong move at the wrong time.
Sell during what turns out to be a correction, and you often lock in your losses right before the market bounces back, missing the recovery entirely. Some of the market's strongest days in history have landed within days of its scariest ones. Ignore what turns out to be a real bear market, and you might ride a much longer, deeper decline than you were prepared for, watching a manageable dip turn into a much bigger dent in your savings.
This is why understanding the backdrop, not just the percentage number, matters so much.
How to Tell Which One You're In
- Check how broad the decline is. If most sectors and most stocks are falling together, and things keep getting worse under the surface, that leans more toward a bear market forming.
- Watch the economic backdrop. Rising unemployment, shrinking corporate profits, and tightening credit are signs of something bigger than a routine pullback.
- Look at how fast things are moving. Sudden, panic-driven plunges over a few days often mark corrections. Slow, grinding declines over many months look more like bear markets.
- Don't expect certainty in the moment. Even professional investors usually can't label a downturn correctly until well after it's already happened.
- Revisit your own risk tolerance before a downturn hits, not during one. Decisions made in a panic tend to be worse than decisions made with a calm head and a plan already in place.
Conclusion
A correction is like a sudden summer thunderstorm: loud, unsettling, and gone before you know it. A bear market is more like winter settling in, slower to arrive, and it takes real time before the weather turns warm again.
You can't control which one shows up. But understanding the difference means you won't mistake a passing storm for a season change, or the start of a long winter for something that will simply blow over by tomorrow.
For traders looking for swing trading picks for US stocks, recognizing the difference between a normal correction and a broader market downturn can help put individual stock moves into the right context.