
Introduction
You did everything right. You bought ten different stocks instead of just one. That's diversification, right? Then the market dropped 5% in a single day, and somehow, all ten of your stocks fell together. What happened to your safety net?
The answer usually comes down to one word: correlation. It's one of the most useful ideas in investing, and one of the most overlooked, especially by traders who think owning "a lot of stocks" automatically means they're protected. For anyone involved in positional trading in USA stocks, understanding correlation can make a big difference when building a portfolio and managing risk.
What Is Market Correlation, Really?
Market correlation measures how two assets move in relation to each other. Do they rise and fall together? Do they move in opposite directions? Or do they barely have anything to do with one another?
Think of two dancers on a stage. Sometimes they move in perfect sync, mirroring every step. Sometimes one steps forward exactly when the other steps back. And sometimes they're dancing to two completely different songs, with no connection at all. Stocks behave the same way. Some move together, some move apart, and some barely notice what the other is doing.
The Correlation Scale: From -1 to +1
Analysts measure correlation using a number called the correlation coefficient. It always falls somewhere between -1 and +1.
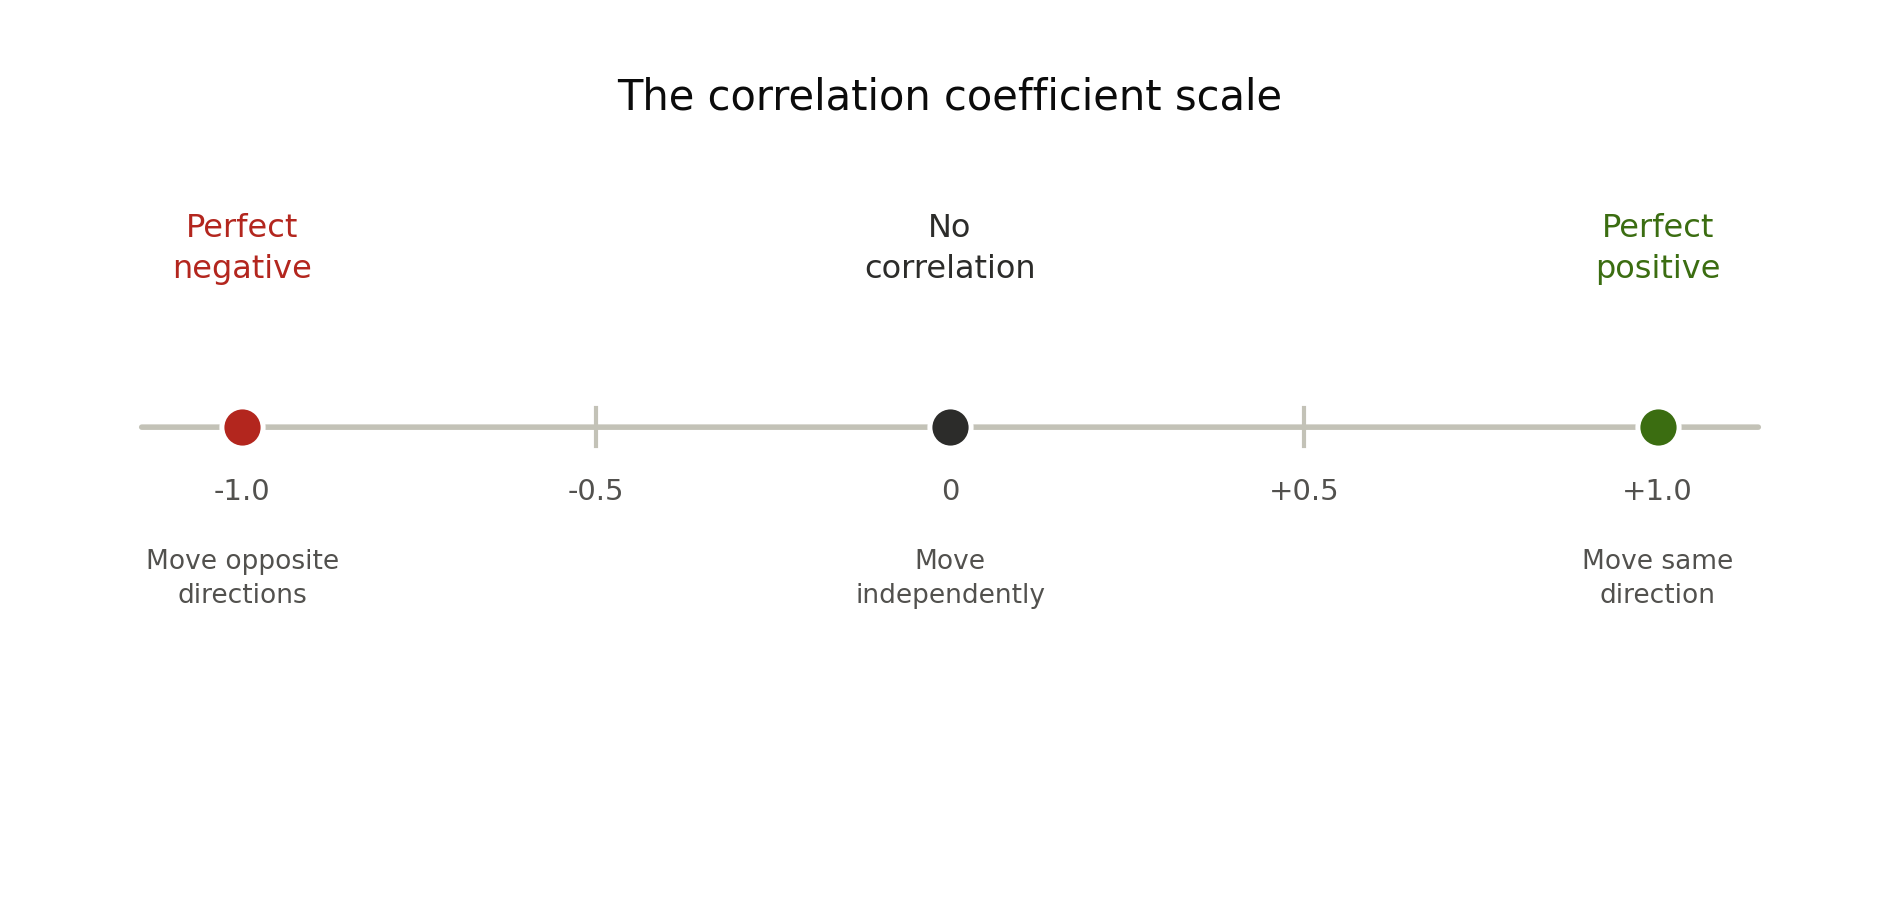
- +1 means perfect positive correlation. The two assets move in the exact same direction, every time.
- 0 means no correlation. The two assets move independently. One has no bearing on the other.
- -1 means perfect negative correlation. The two assets move in exact opposite directions, every time.
In the real world, you rarely see a perfect +1 or -1. Instead, you'll see numbers like 0.7 (strongly positive), -0.5 (moderately negative), or 0.05 (basically unrelated).
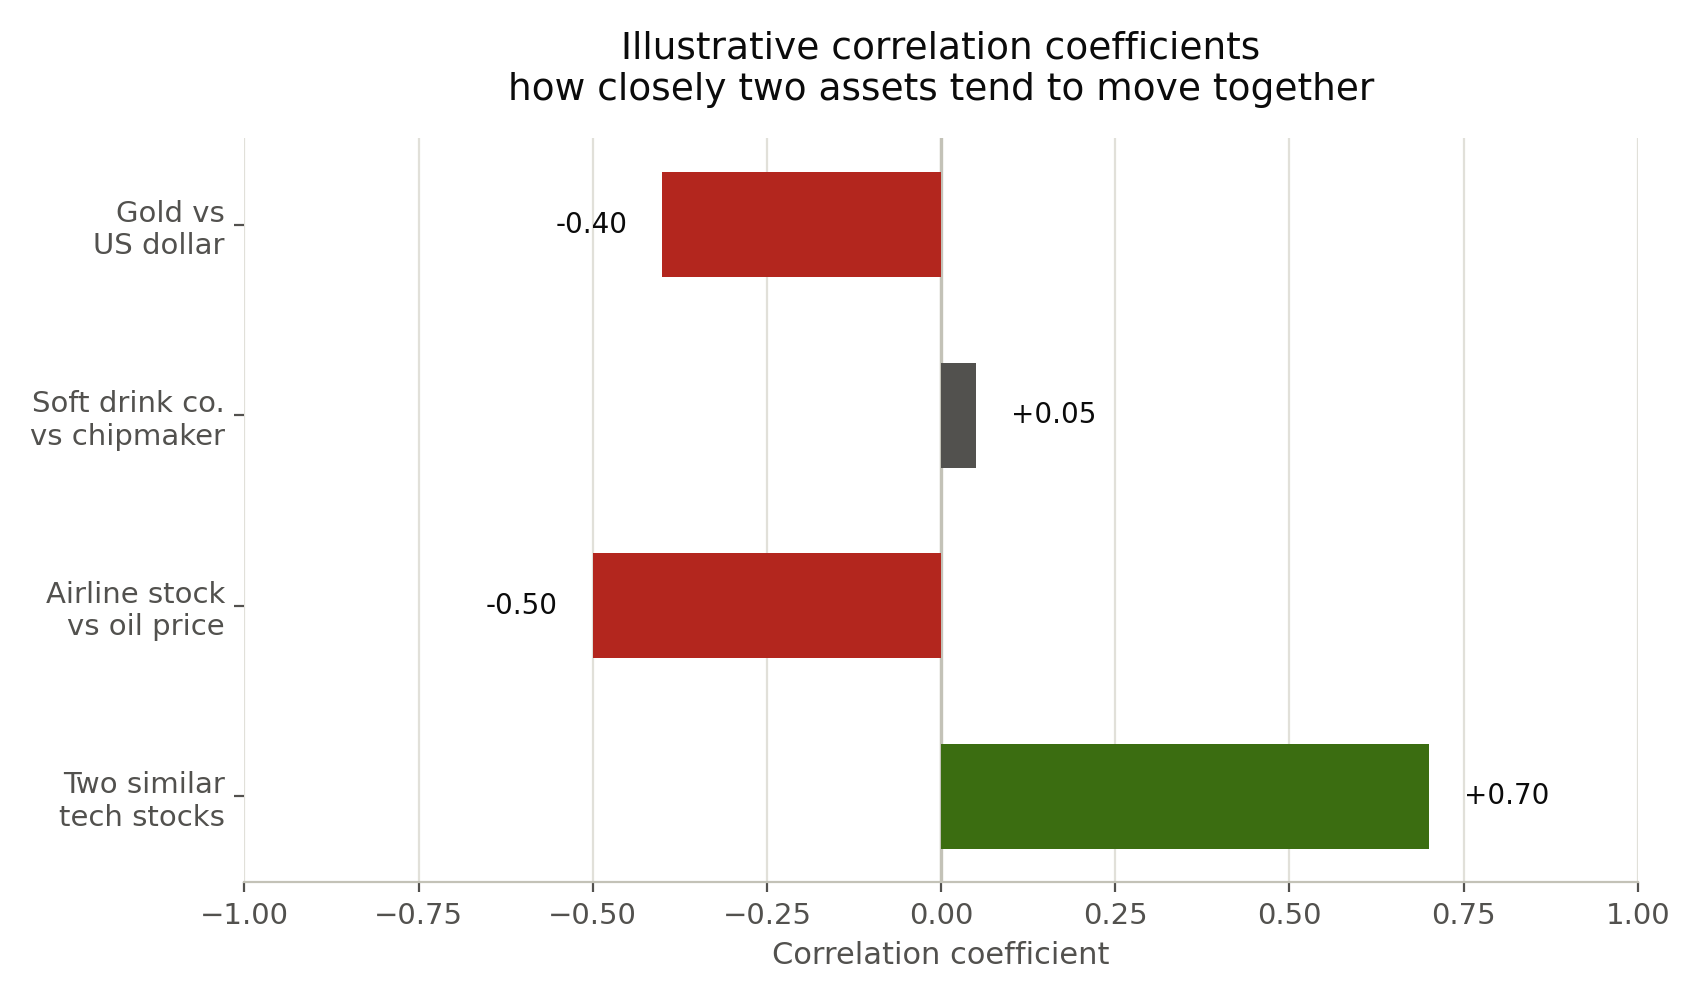
Take two large tech companies that sell similar products to similar customers. Their stocks often rise and fall together, giving them a fairly high positive correlation, say around 0.7. That doesn't mean they move together every single day. It means that most of the time, when one climbs, the other tends to climb too. Now compare an airline stock to the price of oil. When oil gets more expensive, airlines spend more on fuel and their profits often shrink, so the two tend to move in opposite directions, landing somewhere around -0.5. Meanwhile, a soft drink company and a semiconductor maker have almost nothing to do with each other. Their correlation usually sits close to zero, maybe 0.05.
Correlation Isn't the Same as Causation
Here's a trap worth avoiding. Just because two assets move together doesn't mean one is causing the other to move. Sometimes both are simply reacting to the same outside force, like an interest rate decision or a broad shift in investor mood.
Two unrelated companies might show a strong correlation for months, purely by coincidence, then drift apart with no warning. That's why correlation is best used as a clue about how assets tend to behave together, not as a guarantee about why they behave that way, or proof that the pattern will continue forever.
Why This Matters for Diversification
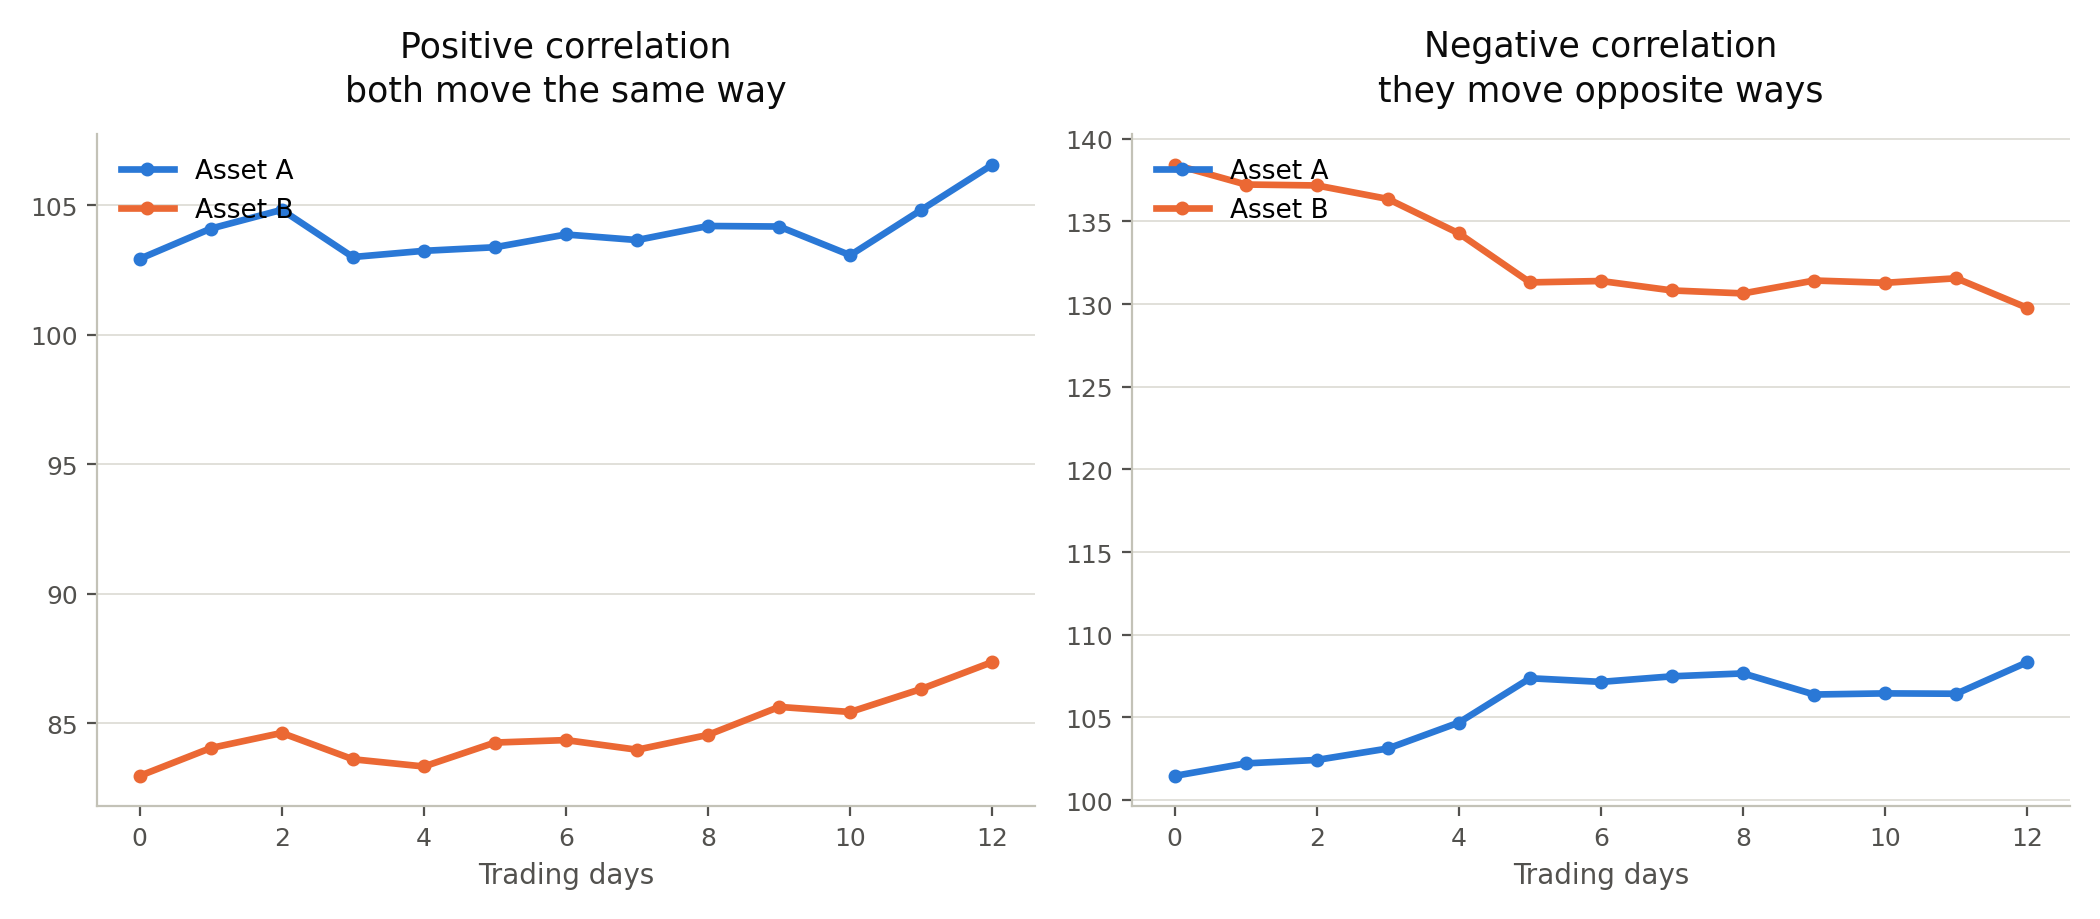
Here's the problem with owning ten stocks that all belong to the same industry. Even though it feels like diversification, if those stocks are highly correlated, they'll often drop together during a downturn. You're not actually spreading your risk. You're just spreading your money.
Real diversification means holding assets that don't all move in the same direction at the same time. When one part of your portfolio dips, another part can hold steady, or even rise, to help balance things out.
Two Portfolios, Two Very Different Outcomes
Let's imagine two investors.
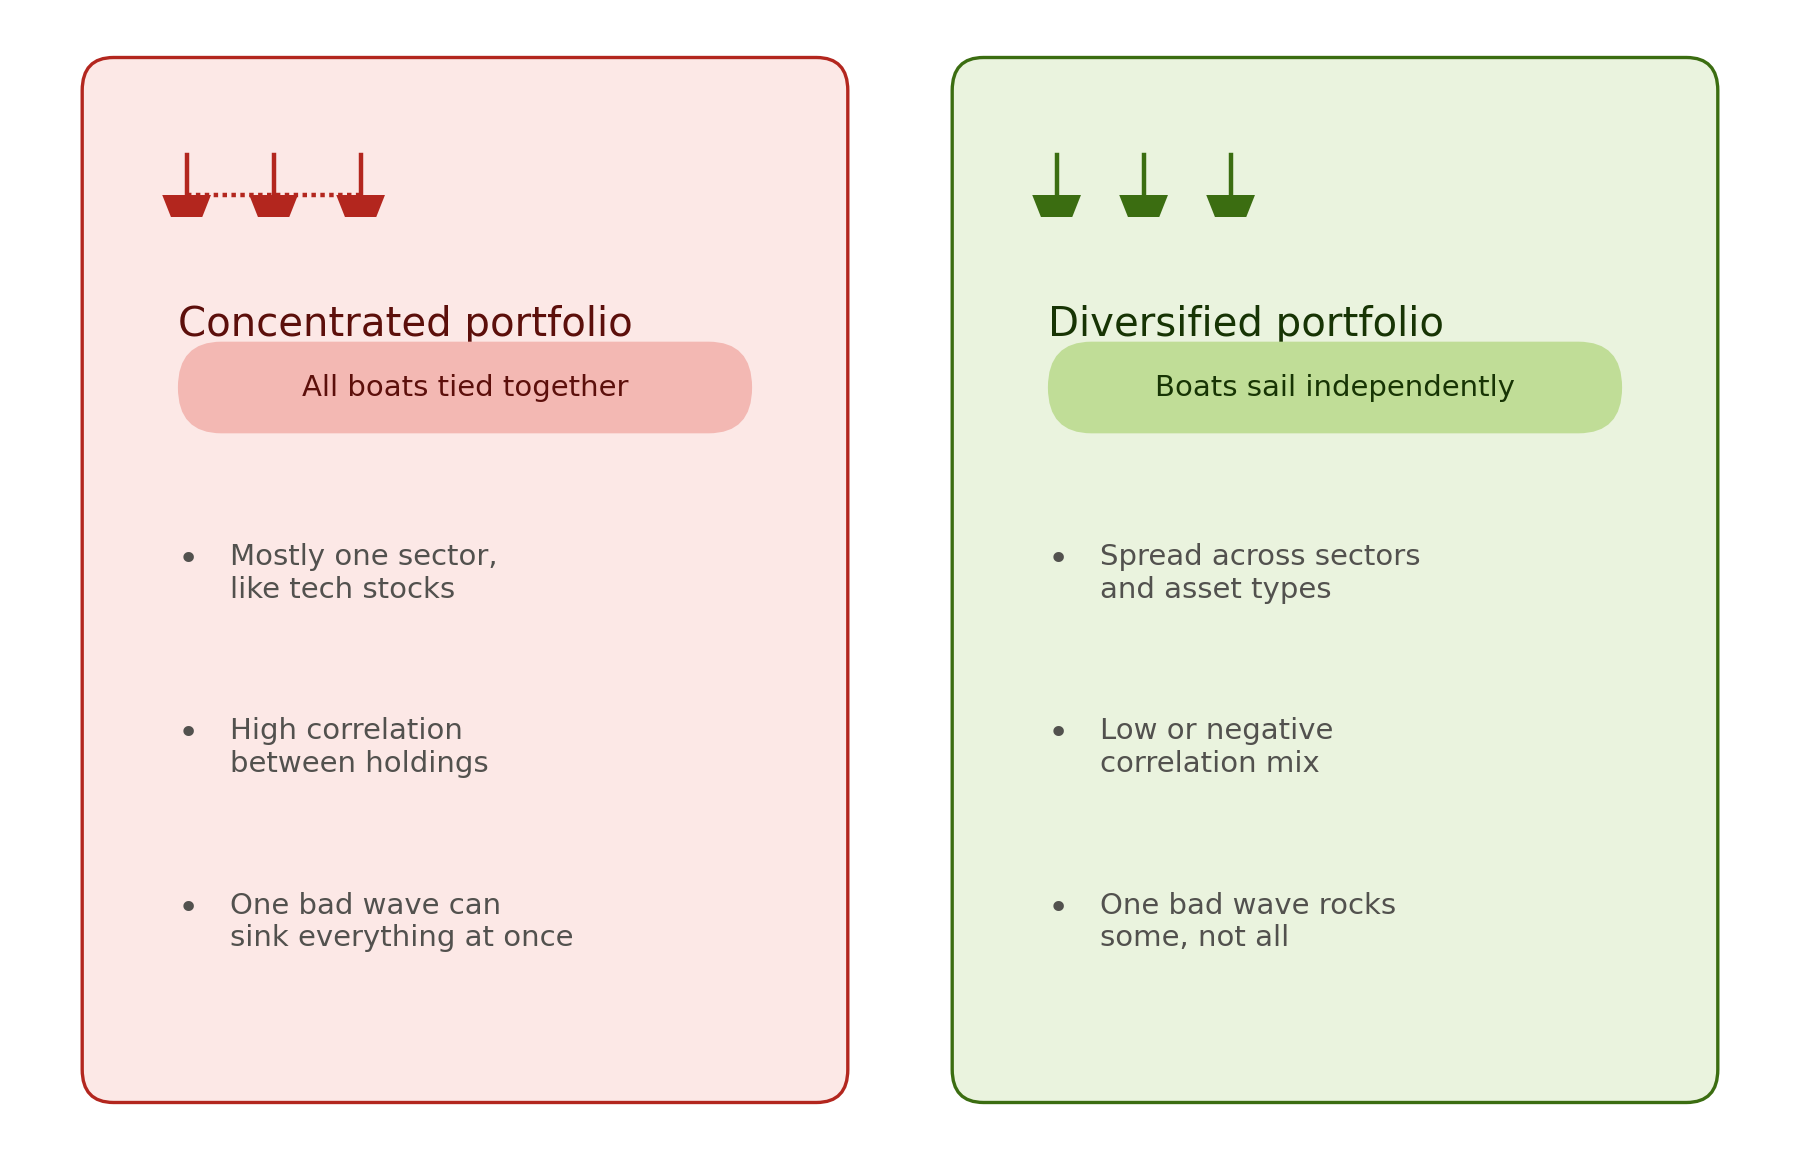
Alex builds a portfolio entirely out of technology stocks. They sell similar products, compete for the same customers, and react to the same news. When a single bad earnings report spooks the tech sector, every stock in Alex's portfolio drops at once.
Jordan builds a portfolio with a mix: some technology stocks, some healthcare stocks, some utility stocks, and a bit of gold. These assets don't all react to the same news the same way. When tech stocks stumble, Jordan's utility and gold holdings often hold their ground, cushioning the fall.
| Factor | Alex (Concentrated) | Jordan (Diversified) |
|---|---|---|
| Correlation between holdings | High, mostly tech stocks | Low, spread across sectors |
| What happens in a downturn | Nearly everything drops together | Some holdings fall, others hold steady |
| Overall portfolio swings | Large and sudden | Smoother and more gradual |
| Real diversification | Looks diversified, isn't | Actually spreads out the risk |
How Traders Actually Use Correlation
Correlation isn't just a diversification tool. Traders build entire strategies around it.
- Pairs trading. Traders find two stocks that usually move together. When one temporarily breaks away from the other, perhaps after a one-off piece of company news, they bet the gap will close again, buying the lagging stock and selling the leading one.
- Hedging. If you own a stock you're worried about, you can offset some risk by holding something negatively correlated with it. When one falls, the other often rises, softening the blow to your overall portfolio.
- Sector rotation. Investors track how different sectors correlate with the broader economy, then shift money toward sectors expected to do well as conditions change, moving from growth-sensitive sectors into steadier ones as the outlook shifts.
- Building balanced portfolios. Mixing assets with low or negative correlation, across stocks, bonds, and even commodities, helps smooth out returns over the long run instead of riding one steep rollercoaster.
What Changes Correlation Over Time
Correlation isn't fixed. It shifts as market conditions change.
- The economy's mood. During strong growth, riskier assets like stocks tend to move together more. During downturns, investors often flee to the same safe havens, like gold or U.S. Treasury bonds, pushing those correlations higher too.
- Interest rates. When rates rise, borrowing gets more expensive, and this ripples across sectors differently, changing how they correlate with each other.
- Big news events. Wars, elections, and major economic reports can cause investors to react as a herd, temporarily pushing correlations higher across the board.
This is why a strategy built on today's correlations might not hold up a year from now. Smart traders check in on these relationships regularly instead of assuming they never change.
A Few Practical Tips
- Before adding a new stock to your portfolio, ask how closely it moves with what you already own.
- Don't confuse owning many stocks with being diversified. Ten correlated stocks behave a lot like one big bet.
- Keep an eye on how correlations shift during market stress. Assets that seem unrelated in calm times can suddenly move together during a crisis.
- Use correlation as one tool among many, not your whole strategy. It tells you how assets relate, not which ones will perform best.
The Takeaway
Picture your portfolio as a small fleet of boats, all sailing together. If every boat is tied to the same rope, one big wave capsizes the whole fleet at once. Cut a few of those ropes, spreading your boats out with assets that don't move in lockstep, and a wave that sinks one boat might barely rock another.
Correlation won't tell you which stock to buy next. But it will tell you whether your portfolio is really as safe as it looks, or whether you've just been tying more boats to the same rope.
For traders using US stock market trading signals, correlation is an important part of looking beyond a single stock setup. A strong signal may look attractive on its own, but understanding how that stock moves relative to the rest of your portfolio can help you manage risk more intelligently.