Introduction
It was July 2019. Wall Street was celebrating. The S&P 500 had just hit fresh all-time highs. Unemployment sat at 3.7%—a 50-year low.
Meanwhile, in the quieter corners of fixed-income trading desks, something strange was happening. The yield on 10-year U.S. Treasury bonds had dipped below the 2-year yield. Traders called it what it was: an inversion. And they knew what it meant.
Eighteen months later, recession hit. The bond market had seen it coming—not the pandemic specifically, but the underlying fragility. It always does.
Let me explain why the bond yield curve is the best recession predictor we've got, and why you should be watching it right now.
The Setup: What Even Is a Yield Curve?
Picture the bond market as a fortune teller—except instead of crystal balls, it uses mathematics and collective investor intelligence.
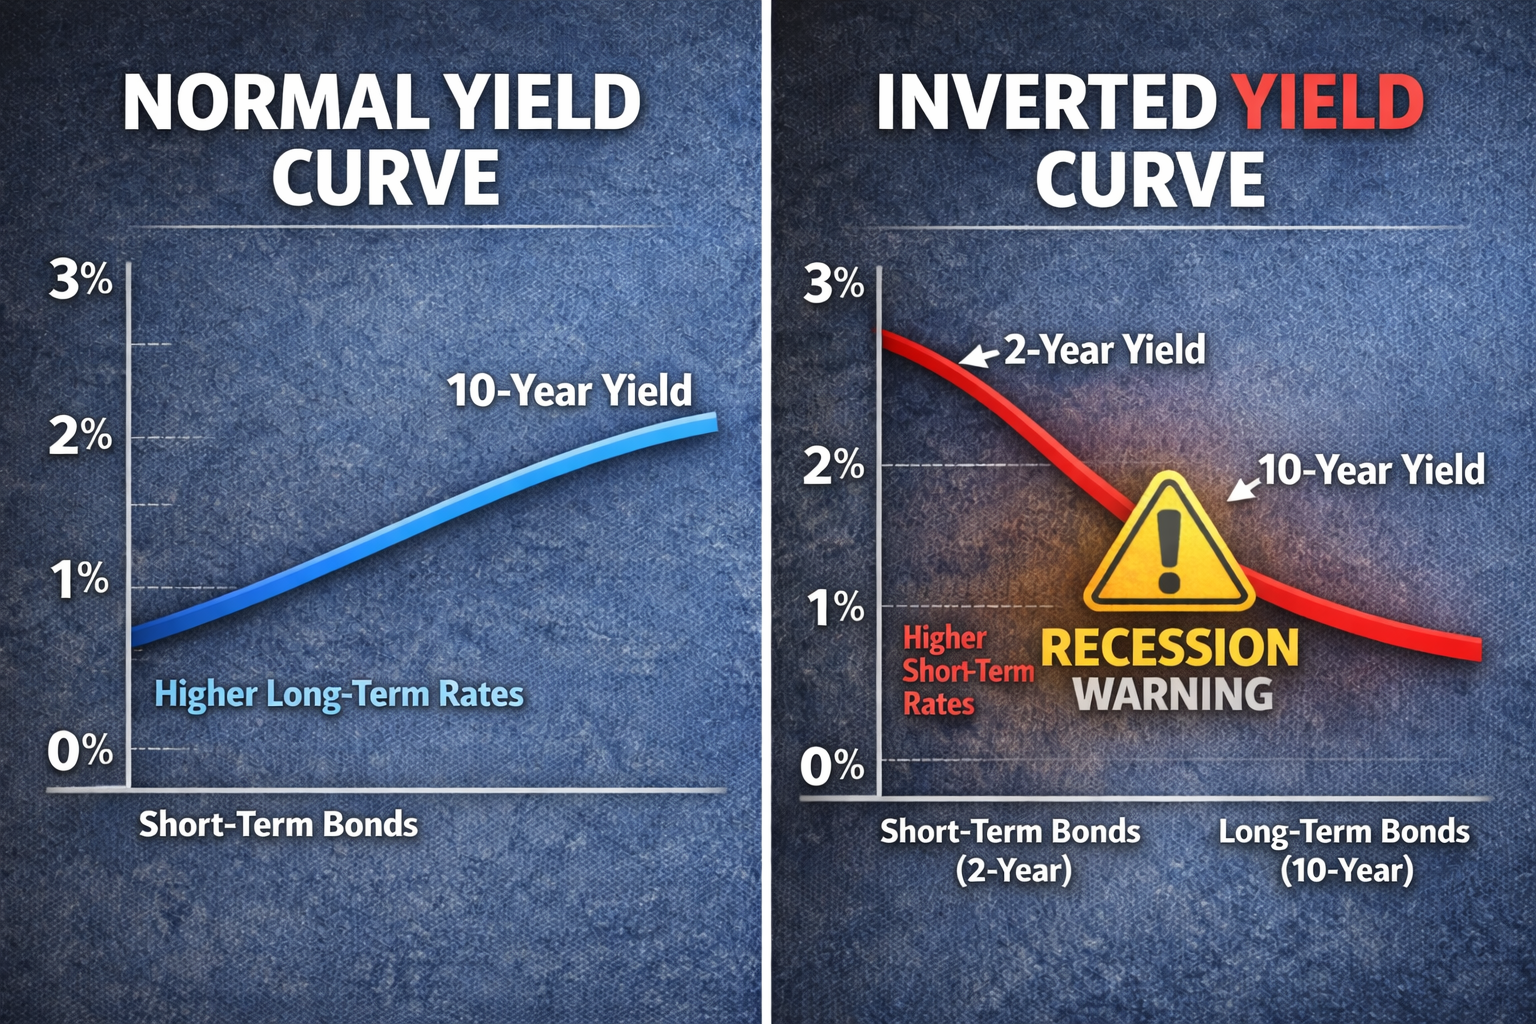
Here's the thing: when you lend money to the government (by buying Treasury bonds), you expect to be paid interest—the yield. Logically, if you lend money for 10 years instead of 2 years, you'd want more interest, right? You're taking more risk by locking up your money longer.
So normally, the yield curve meaning is simple: longer-term bonds pay higher yields than short-term bonds. Plot this on a graph, and you get an upward-sloping curve. That's a normal yield curve.
But sometimes, the curve flips. Short-term bonds suddenly pay more than long-term bonds. The graph inverts. That's a yield curve inversion—and historically, it's been the most reliable recession signal we have.
Why The Numbers Are Unsettling
Let's start with the track record:
- Every U.S. recession since 1955 has been preceded by a yield curve inversion
- The lag time? Typically 12 to 24 months between inversion and recession
- False positives? Only one—a brief inversion in the mid-1960s
To put it differently: when the 10-year/2-year spread inverts, there's roughly an 80-85% probability of recession within two years. That's seven decades of data.
Here's what happened recently:
- March 2022: The curve inverted for the first time since 2019
- July 2022–October 2023: The inversion deepened, with the 10-year falling 100 basis points below the 2-year
- Current status: The curve has steepened, but the damage may already be done
For anyone tracking US trading advice, these inversions aren't academic—they're advance warnings that fundamentally change how you position capital.
The mechanism is simple: when investors believe trouble is coming, they buy long-term bonds (driving yields down) while short-term rates stay high due to Fed policy. The curve inverts. And what follows isn't pretty.
What This Means For Your Money
If you're invested in equities:
Bad news travels slowly, then all at once. Inversions don't crash markets immediately—they give you 12-24 months of false security before the pain hits. The 2019 inversion? The S&P 500 rallied for months. Then came 2020.
Bond yields during recession tell you what's happening beneath the surface. When long-term yields drop, it's because investors are fleeing to safety.
If you hold bonds:
Your bond prices during recession typically rise as yields fall—which sounds great until you realize it's because the economy is imploding. Long-term Treasuries become the safe haven. But if you're holding short-term bonds, you miss the capital appreciation.
The smart money moves before recession, not during.
If you're planning major purchases or expansion:
An inverted curve is the bond market saying: "Wait. Don't borrow. Don't expand." Why? Because within 12-24 months, credit tightens, demand drops, and financing becomes ruinously expensive.
If you're a working professional:
Recessions mean layoffs. The bond recession signal is your early warning—not to panic, but to prepare. Build your emergency fund. Avoid unnecessary debt. The bond market is giving you time to adjust.
The Big Winners
Long-Term Bond Holders:
When the curve inverts and recession follows, long-term Treasury bonds become the best-performing asset class. As the Fed slashes rates, your 10-year or 30-year bonds skyrocket in value. It's one of the few truly asymmetric bets in finance.
Cash-Heavy Investors:
Those sitting on cash during an inversion can deploy capital at the bottom, when everyone else is capitulating. Recessions create generational buying opportunities—but only if you have dry powder.
Defensive Sector Stocks:
Utilities, consumer staples, healthcare—these sectors outperform when the yield curve explained inversion begins. Investors flee growth stocks and pile into dividend-paying, recession-resistant companies.
Short Sellers & Contrarian Traders:
If you're sophisticated enough to short equities after an inversion deepens, you can profit enormously. But timing is everything—most retail investors get crushed trying this.
What The Market Compromises On
Let's be transparent: yield curve inversions aren't perfect.
They give you a time window, not a date. The 2019 inversion led to recession 18 months later. Imagine sitting in cash, watching markets rally another 15% while you wait. That's the psychological torture of being "early."
The Federal Reserve can interfere. Aggressive rate cuts can sometimes prevent recession—or delay it. In 1995, Fed intervention helped avoid a full downturn despite curve signals. It's rare, but possible.
External shocks matter. COVID accelerated the 2020 recession, but wasn't the cause—the economy was already fragile. Inversions predict economic weakness, not pandemics or wars.
The Unseen Benefits
1. It Forces Discipline:
When the bond market screams "recession coming," it prevents stupid decisions. You don't refinance into a bigger house. You don't lever up on risky trades. The inversion instills caution—and caution saves portfolios.
2. It Reveals Fed Policy Errors:
Inversions often happen because the Fed raised rates too aggressively. The bond market tells them: "You've gone too far." And historically, the bond market has been right.
3. It Offers Asymmetric Opportunities:
Knowing a recession is likely 12-24 months out gives you time to raise cash and prepare to buy assets at distressed prices. Most investors react during recessions. The curve lets you act before.
4. It Separates Signal From Noise:
Markets are full of pundits predicting crashes weekly. The bond yield curve doesn't care about opinions—it's pure data. When it inverts, you pay attention. When it doesn't, you ignore the noise.
The Reality Check: What Could Go Wrong
The curve can stay inverted longer than you think. The 2022-2023 inversion lasted 18 months without immediate recession. If you panicked and sold everything in March 2022, you missed significant gains.
Sometimes inversions are caused by technical factors—quantitative easing, foreign central bank buying—rather than pure economic pessimism. The signal can be distorted.
And here's the hardest part: even when you're right about recession, you can lose money by mistiming your trades. Being early in markets is often indistinguishable from being wrong.
The Bigger Picture
The yield curve explained in simple terms: it's the aggregated wisdom of millions of investors, voting with trillions of dollars on where the economy is headed. When they invert the curve, they're saying: "We don't believe this expansion continues."
And they've been right seven out of eight times over 70 years.
This isn't some esoteric indicator for bond nerds. It's the closest thing finance has to a crystal ball. It won't tell you when recession hits—but it will tell you one is coming, giving you time to prepare.
By 2027, we'll know whether the 2022-2023 inversion was another accurate signal or a rare false alarm. But history suggests betting against the bond market is a losing proposition.
The Takeaway
The yield curve inversion isn't a guarantee—it's a probability. And when that probability sits at 80%+, ignoring it is financial malpractice.
Retail investors gain time to reposition portfolios, reduce risk, and build cash.
Bond investors gain an opportunity to lock in long-term yields before the Fed slashes rates.
Businesses gain advance warning to tighten operations and prepare for weaker demand.
And for market participants, this indicator creates clear tactical opportunities—from rotating into defensive sectors and extending bond duration to preparing capital for the inevitable distressed-asset buying opportunities that recessions create.
That's why, over the coming quarters, the shape of the yield curve will be closely tracked not only by central bankers and institutional investors, but by every US swing trading advisor looking to identify when economic cycles shift from expansion to contraction.
Welcome to the bond market's recession playbook—the one signal that's seen it all before, and keeps seeing it before everyone else.