

- Naranj Research Desk
- 🇸🇦 Saudi Stock Market
- 🇺🇸 USA Stock Market


RASAN — TASI —

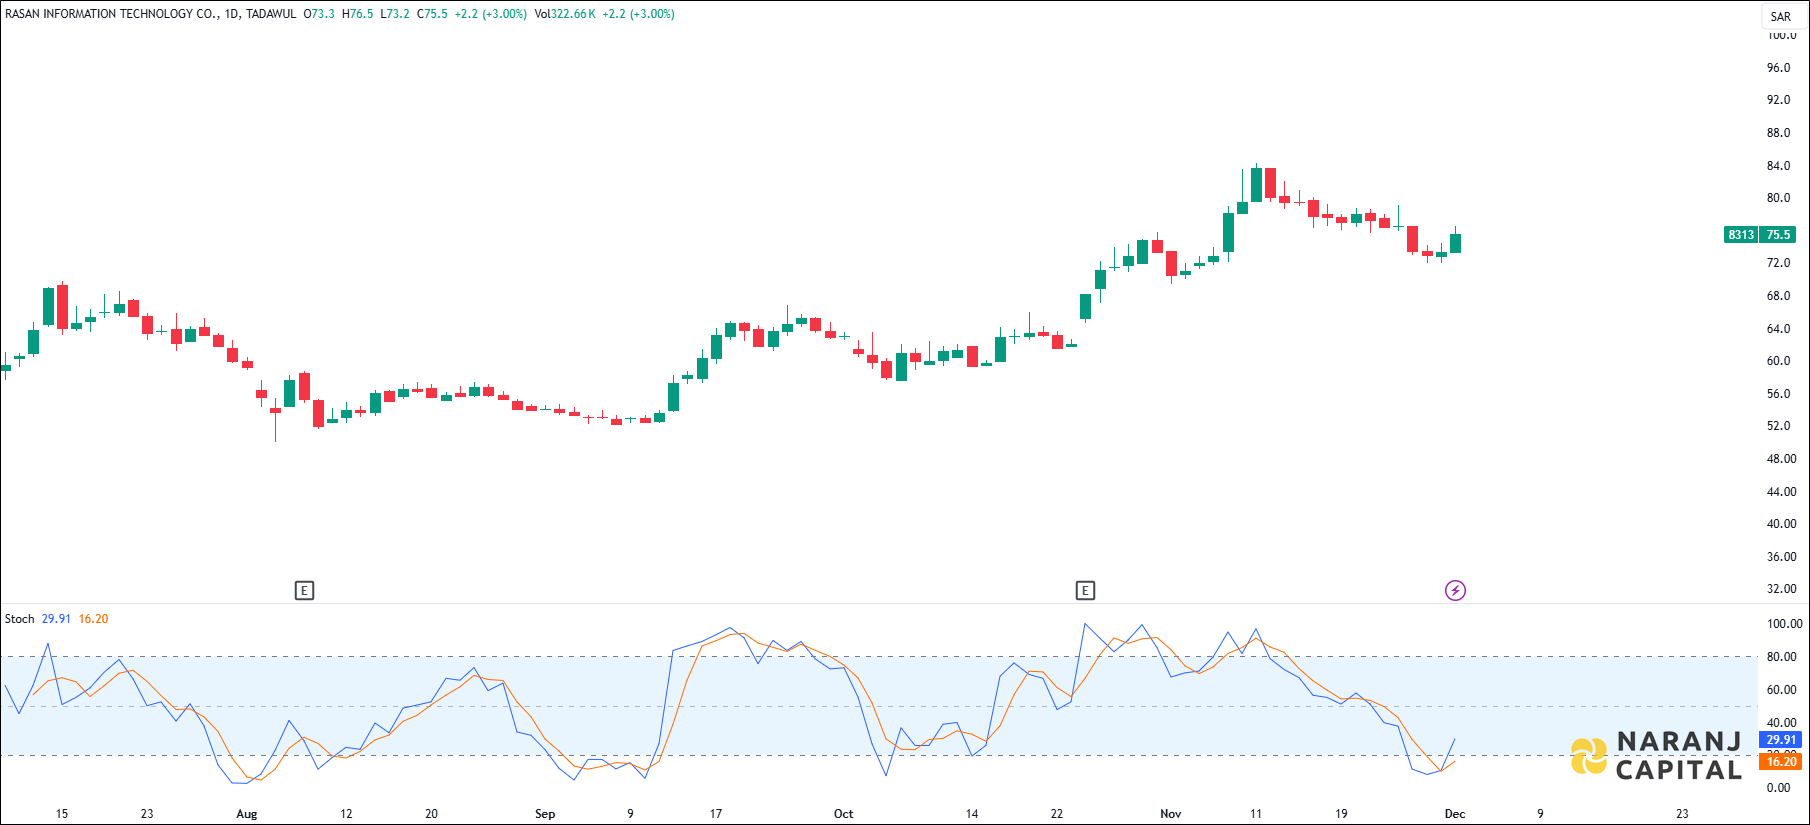
A bullish signal is generated as the K line (blue) crosses over the D line (orange) from below, indicating a reversal from oversold conditions.

Increasing ADX value above 20, indicated the strength of the trend, thereby uptrending ADX confirms the bullish or bearish supportive decisions. Along with the rising ADX, and the +DI is above (or crossing) -DI, indicates the long trades should be favoured.
Based on our stock trading advice in Saudi Arabia, Rasan Information Technology stock price target will be SAR 80 - SAR 82 in the next 08-10 trading sessions.


RASAN — TASI —
A bullish signal is generated as the K line (blue) crosses over the D line (orange) from below, indicating a reversal from oversold conditions.
Increasing ADX value above 20, indicated the strength of the trend, thereby uptrending ADX confirms the bullish or bearish supportive decisions. Along with the rising ADX, and the +DI is above (or crossing) -DI, indicates the long trades should be favoured.
Based on our stock trading advice in Saudi Arabia, Rasan Information Technology stock price target will be SAR 80 - SAR 82 in the next 08-10 trading sessions.


