Buy Astra Industrial Group | Tadawul 1212 | 40-45% gain | KSA stock investment idea on 23 Oct 2024

Stock Market

Tadawul, Saudi Arabia

  • Buy
  • Buy
    Range
  • Target
  • Stoploss
  • Upside
    Potential
  • Trade
    Duration
  • Astra Industrial Group
  • 160 - 170
  • 235 - 250
  • -
  • 40% - 50%
  • 14 - 18 Days
  • Buy Astra Industrial Group
  • Buy
    Range
    160 - 170
  • Target 235 - 250
  • Stoploss -
  • Upside
    Potential
    40% - 50%
  • Trade
    Duration
    14 - 18 Days
  • * Once the first target hit, reset the StopLoss at your buying price.
    * Trade durations are approximate; actual holding period may vary.

    Tadawul 1212 : Astra Industrial Group - Stock Overview

  • Tadawul code
  • Stock Name
  • Sector
  • 52 Weeks High
  • 52 Weeks Low
  • 1212
  • Astra Industrial
  • Capital Goods
  • -
  • -
  • Tadawul code 1212
  • Stock Name Astra Industrial
  • Sector Capital Goods
  • 52 Weeks High -
  • 52 Weeks Low -
  • Company profile

    Astra Industrial Group is based in Riyadh, Saudi Arabia, where it specializes in the production, marketing, and distribution of a wide range of products. These include pharmaceuticals, polymer compounds, plastic additives, color concentrates, and various plastic items, as well as pre-engineered steel buildings and structures, both domestically and internationally. The company also has a strong focus on the energy sector, particularly in power generation, distribution, substations, and power rental services.

    Astra Farms is dedicated to cultivating a variety of products, including fruits, vegetables, flowers, quails, poultry, dairy, and processed foods.

    Astra Grains, primarily situated in Jeddah, is involved in the general trading of food commodities, offering items such as nuts, pulses, spices, edible oils, coffee, rice, and more.

    Astra Commercial operates in the northwestern region of Saudi Arabia, focusing on the retail and wholesale of grocery products, bakery items, and gas stations. Additionally, Astra Industries is active in sectors such as mining, financial services, investment, education and healthcare, real estate, hospitality, media, and telecommunications.

    The subsidiaries of the group operate both within and outside the Kingdom of Saudi Arabia.
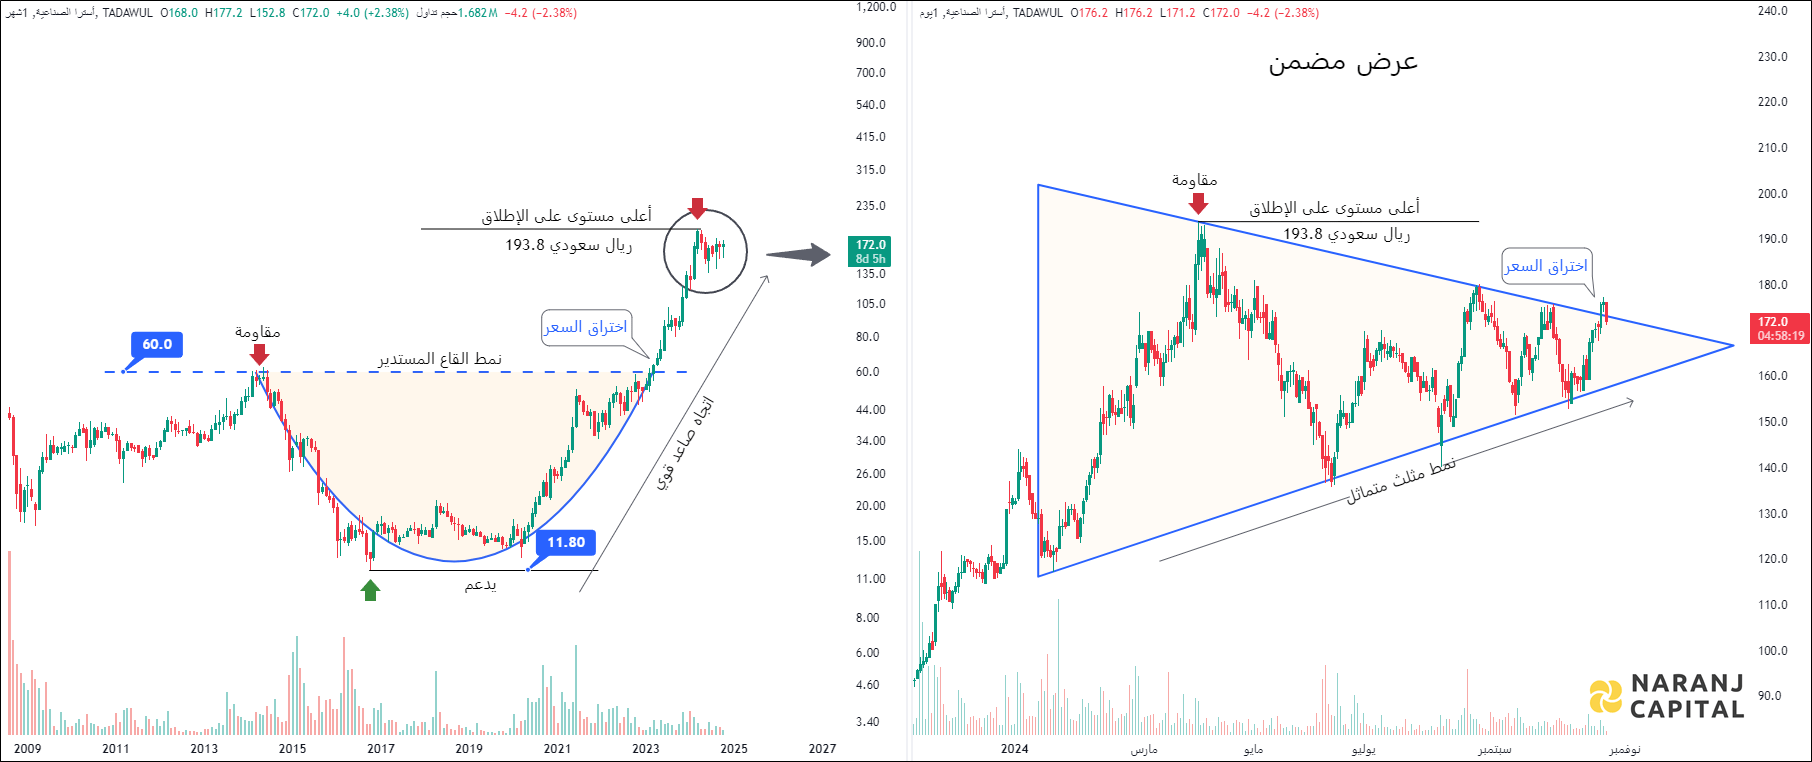
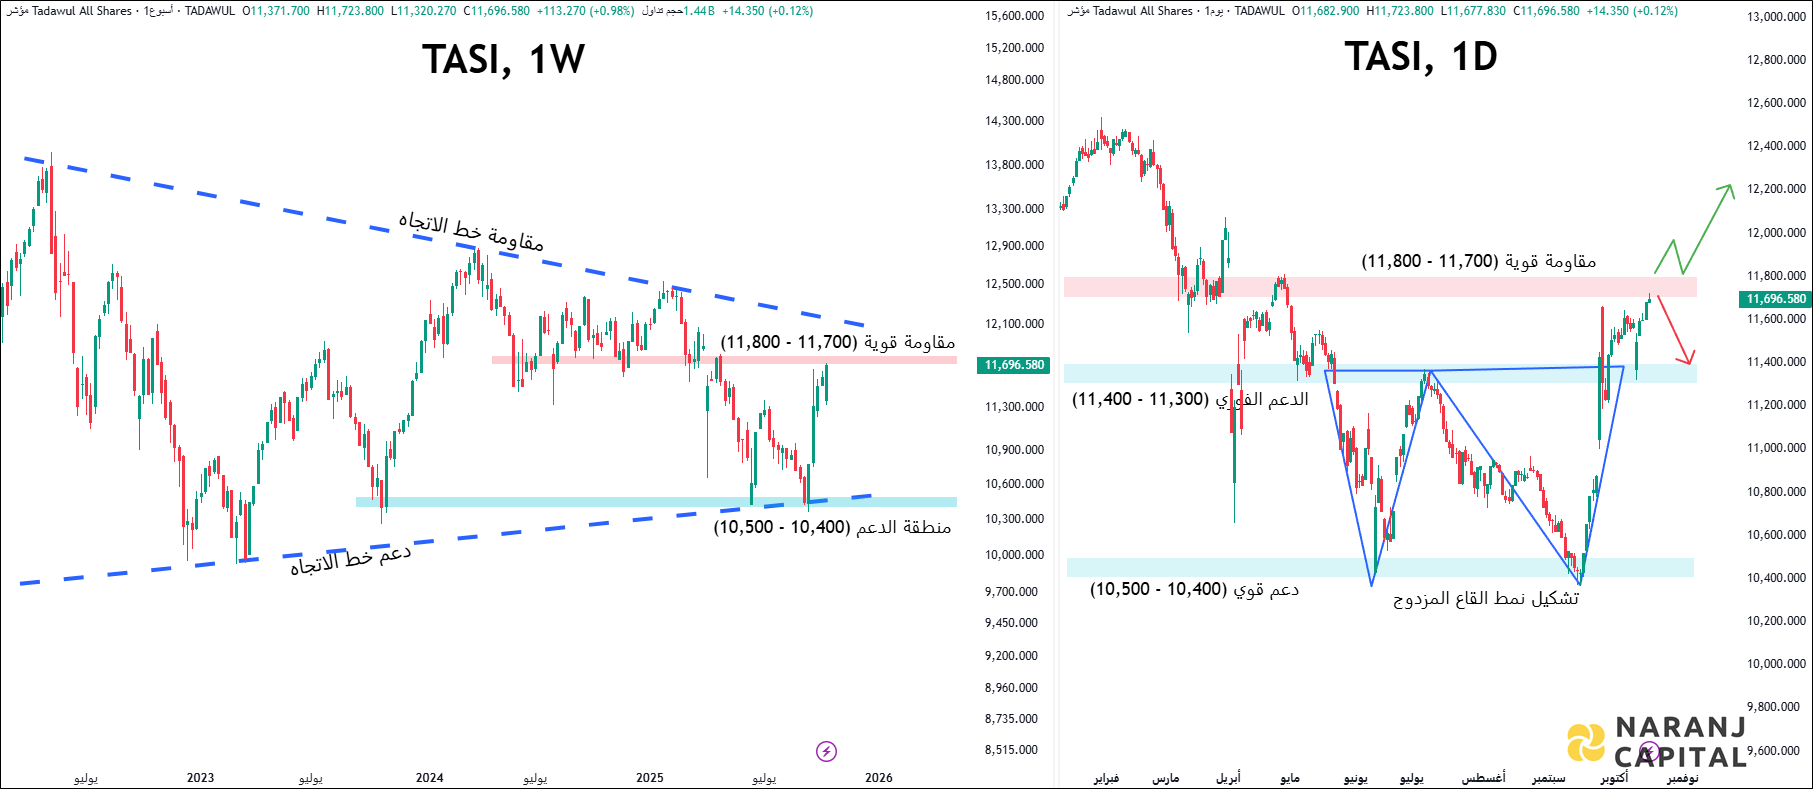
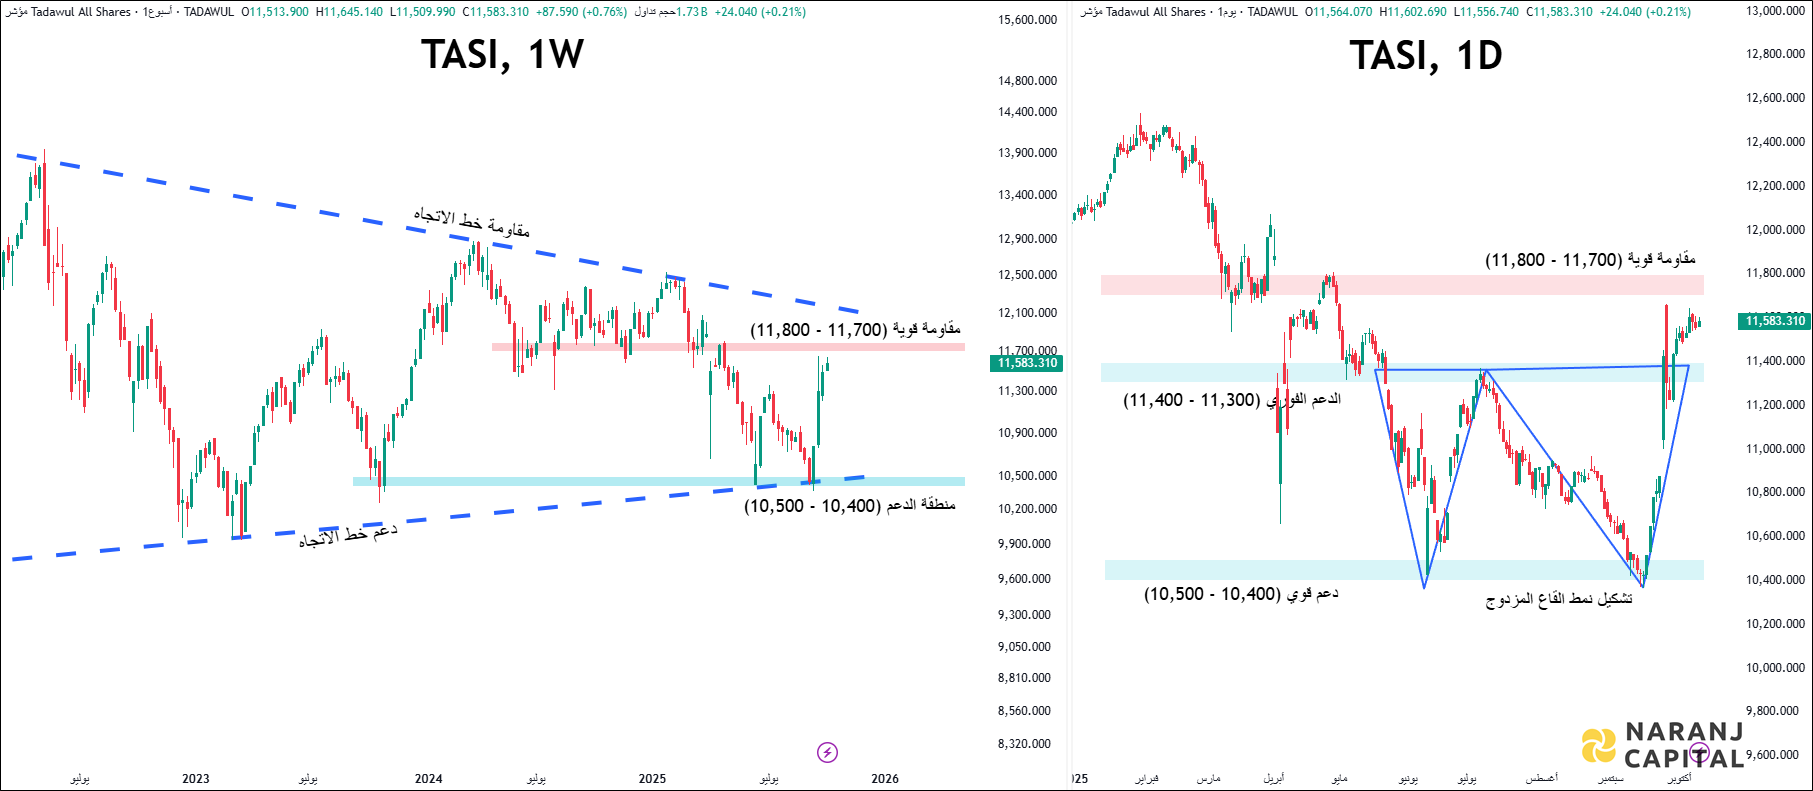
    Market Capitalization – ‪14.10 B‬ SAR

  • Tadawul 1212 : Astra Industrial Group vs TASI - Relative Strength Comparison

    Relative Performance - Last 1 Year
    ASTRA —   TASI —

    • The chart clearly illustrates that AIG has outperformed the Tadawul all-share index by a remarkable margin, achieving an outstanding annual return of 89%.
  • Tadawul 1212 : Astra Industrial Group - Technical Analysis

    Astra Industrial Group - Technical Analysis
    Astra Industrial Group - Technical Analysis

    Monthly Chart

    • The historical chart indicates that the stock encountered significant resistance at the 60 level in March 2014, resulting in a decline.
    • It later found support around the 12 level and consolidated for an extended period before initiating an upward trend.
    • After a sustained rally, the price broke through its previous resistance.
    • This breakout propelled the price to an all-time high close to 194.
    • Afterward, a short pullback took place due to rejection from the peak.
    • At present, the price is rising once more, and this upward momentum is expected to persist.

    Daily Chart

    • A distinct Symmetrical Triangle pattern is emerging on the daily chart.
    • It is expected that the price will soon break out of this pattern, setting the stage for an upward movement.
  • Tadawul 1212 : Astra Industrial Group - Revenue & Profit Analysis

    Year-on-year

    Astra Industrial Group - Revenue & Profit Analysis (YoY)

    • In FY23, the company achieved a commendable revenue growth of 10%, totaling 2,858 million SAR, a notable rise from 2,594 million SAR in FY22.
    • The EBITDA increased significantly, climbing to 615 million SAR from 502 million SAR during the same period.
    • Moreover, the company has successfully enhanced its EBITDA margin to 21.5%, up from 19.35%, reflecting a positive trend that has been evident over the past several fiscal years.

    Quarter-on-quarter

    Astra Industrial Group - Revenue & Profit Analysis (YoY)

    • In the most recent June quarter, the company reported revenue of 819 million SAR, a slight dip from the March quarter's 833 million SAR. However, when compared year-on-year, this figure marks a remarkable increase of 24% from 660 million SAR.
    • The EBITDA for this latest quarter also saw a decrease, falling to 182 million SAR from 188 million SAR in the March quarter.
    • The basic EPS (LTM) remained stable at 6.26 SAR for the June quarter, unchanged from the March quarter. Nevertheless, this figure represents a significant improvement from 5.02 SAR in the same quarter last year.
  • Tadawul 1212 : Astra Industrial Group - Valuation

    P/E Ratio

    • This stock presents a compelling valuation, boasting a Price-To-Earnings Ratio of 27.3x, which is significantly lower than the peers average of 48.9x.

    P/B Ratio

    • With a P/B ratio of 6.1x, this stock appears to be reasonably valued when compared to the peer average of 7.1x.

    PEG Ratio

    • The PEG ratio of 0.67 indicates that the stock is undervalued in relation to its anticipated earnings growth.
  • Tadawul 1212 : Astra Industrial Group - Cash Flow Analysis

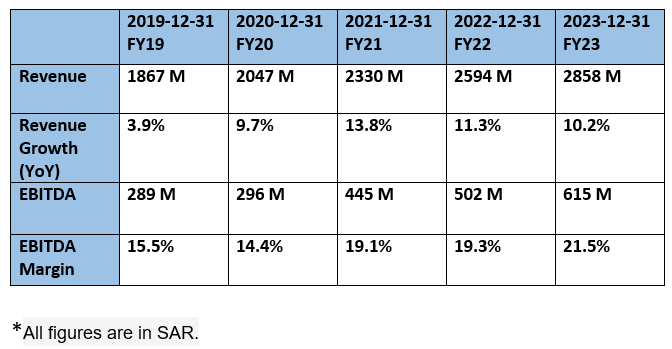
    • In the fiscal year 2023, cash flow from operations saw an impressive surge of 90%, rising to 681 million SAR compared to 357 million SAR in FY22. This remarkable growth underscores the strength and efficiency of company’s operational strategies.

  • Tadawul 1212 : Astra Industrial Group - Debt Analysis

    Astra Industrial Group - Debt Analysis

    • As of June 2024, AIG’s total debt stands at 1,055 million SAR, leading to a debt-to-equity ratio of 0.46.
    • With an interest coverage ratio of 20, it’s evident that the company is well-equipped to manage its loan interest payments regularly.
  • Tadawul 1212 : Astra Industrial Group - Top Shareholders

    • Mohammad Al Otaibi (Board Member, Astra Industrial Group)
      • Shares Held - 3.25%
    • The Vanguard Group
      • Shares Held - 1.66%
    • Sabih Taher Al-Masri (Chairman, Astra Industrial Group)
      • Shares Held - 1.02%
    • Khaled Sabih Al-Masri (Board Member, Astra Industrial Group)
      • Shares Held - 1.02%
    • Blackrock Inc.
      • Shares Held - 0.85%
  • Conclusion

    Astra Industrial Group (AIG) is poised for significant growth in the context of Saudi Arabia's expanding economy, driven primarily by its pharmaceutical and diversified industrial sectors.

    Pharmaceutical Growth

    Market Leadership: AIG's subsidiary, Tabuk Pharmaceuticals, is a major player in the Saudi pharmaceutical market, expected to benefit from government initiatives aimed at boosting local production. The pharmaceutical segment is projected to grow at a 10.3% CAGR from 2022 to 2027, with high margins providing stability against lower-margin segments.

    Recent Performance: The company reported a remarkable 25% increase in earnings per share (EPS) over the past year, reflecting strong operational efficiency.

    Diversification and Industrial Segments

    Specialty Chemicals and Mining: AIG's subsidiaries in specialty chemicals and mining are also set for growth. The specialty chemicals segment has shown a 10.9% CAGR from 2018 to 2022, while Astra Mining is expanding its production capacity significantly, which could enhance revenue contributions over time.

    Steel Sector Growth: The steel segment has shown promising growth, particularly linked to the construction boom in Saudi Arabia, with expectations of continued strong performance in the coming years.

    Economic Context

    Alignment with Vision 2030: AIG's strategic focus aligns well with Saudi Arabia's Vision 2030 initiative, which emphasizes economic diversification away from oil dependency. This alignment positions AIG favourably within the growing industrial landscape of the Kingdom.

    In summary, Astra Industrial Group's robust performance in pharmaceuticals, coupled with strategic diversification into chemicals and mining, positions it well to leverage opportunities within Saudi Arabia’s dynamic economic environment.

  • Share with
    0 0 votes
    Article Rating
    Subscribe
    Notify of
    guest
    0 Comments
    Inline Feedbacks
    View all comments

    Join Our Telegram Channel for Saudi Stock Market Update

    Saudi Stock Analysis

    Join Our Telegram Channel for USA Stock Analysis Update

    Details of Arijit Banerjee

    Arijit Banerjee CMT CFTe is a seasoned expert in the financial industry, boasting decades of experience in trading, investment, and wealth management. As the founder and chief strategist of Naranj Capital, he’s built a reputation for providing insightful research analysis to guide investment decisions.

    Arijit’s credentials are impressive, holding both the Chartered Market Technician (CMT) and Certified Financial Technician (CFTe) designations. These certifications demonstrate his expertise in technical analysis and financial markets.

    Through Naranj Capital, Arijit shares his market insights and research analysis, offering actionable advice for investors. His work is featured on platforms like TradingView, where he publishes detailed analysis and recommendations.

    If you’re interested in learning more about Arijit’s work or Naranj Capital’s services, you can reach out to them directly through their website