- Naranj Research Desk
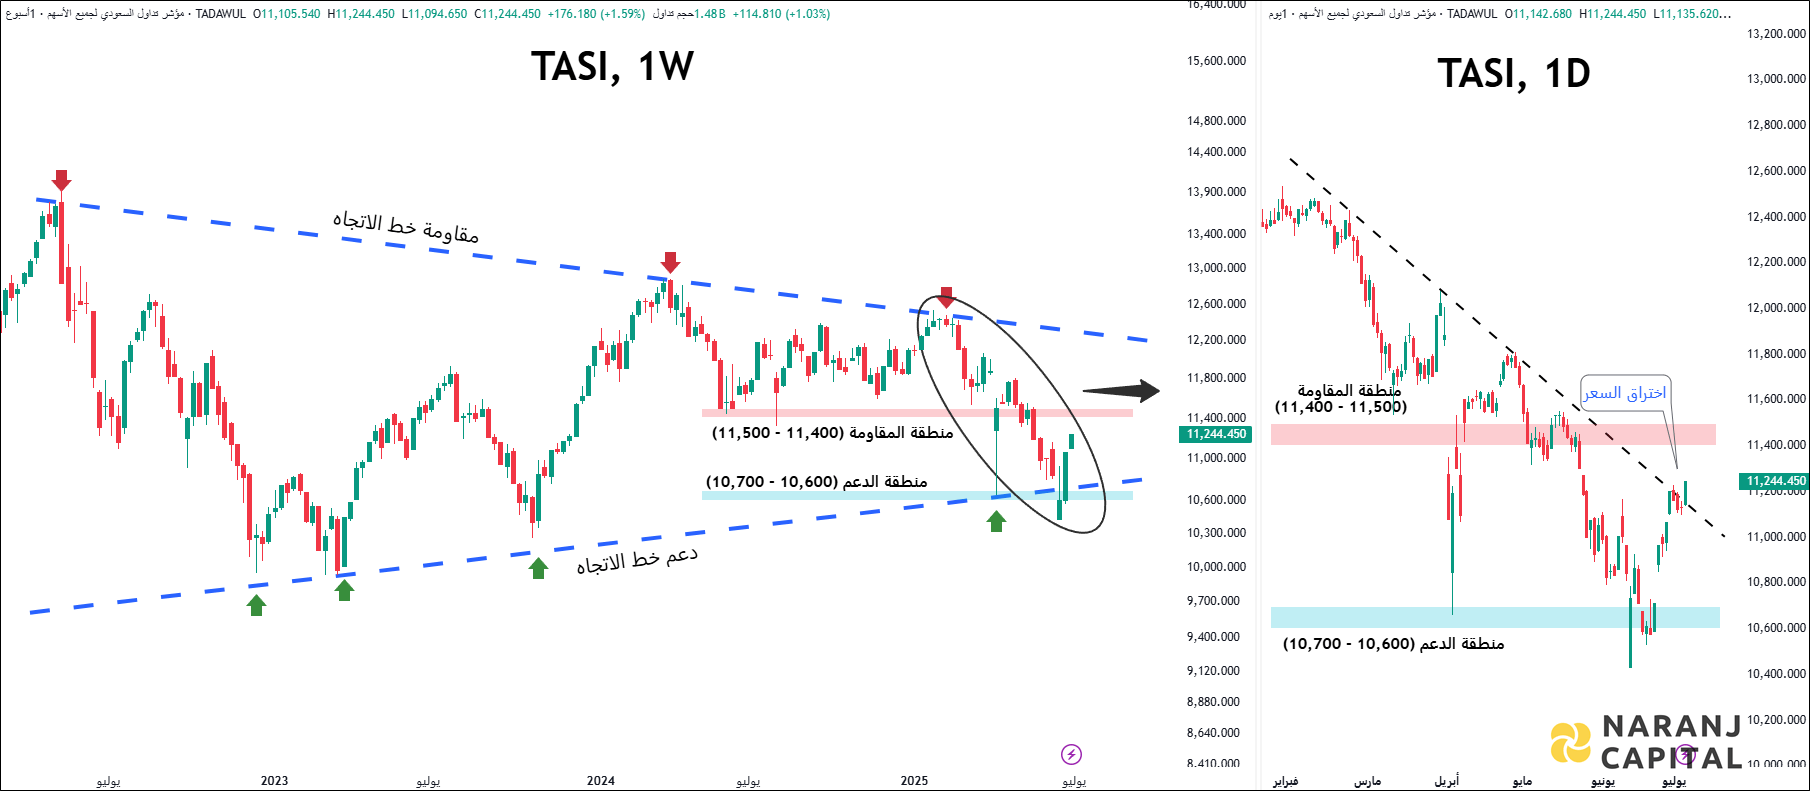
- 🇸🇦 Saudi Stock Market
- 🇺🇸 USA Stock Market


25% - 28%
5 - 7 months
25% - 28%
5 - 7 months
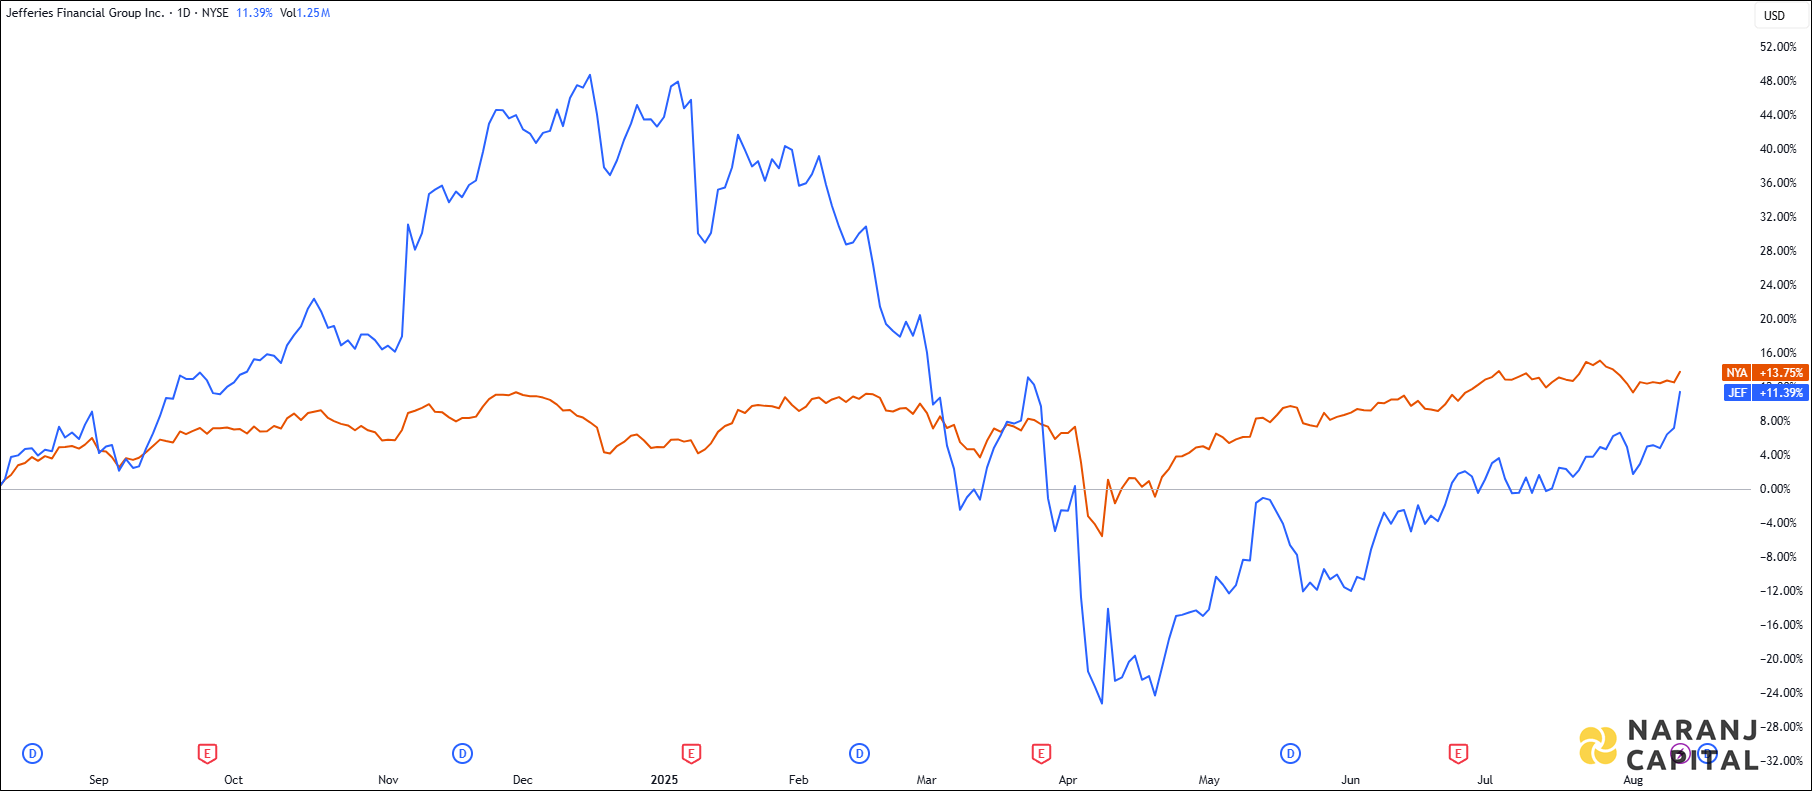
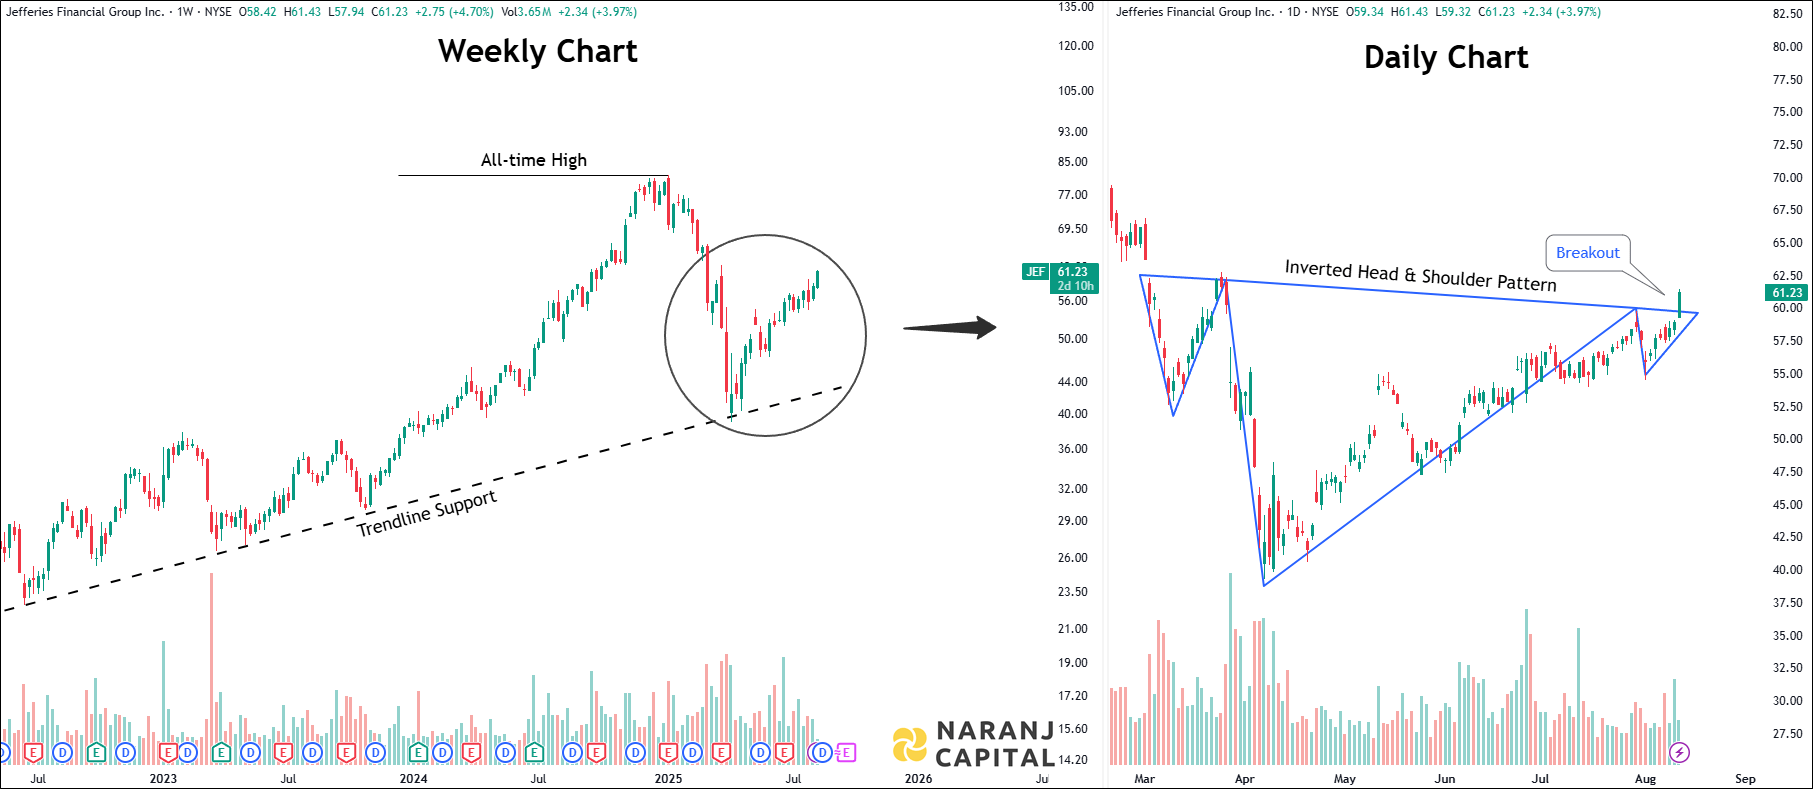
JEF — NYSE —
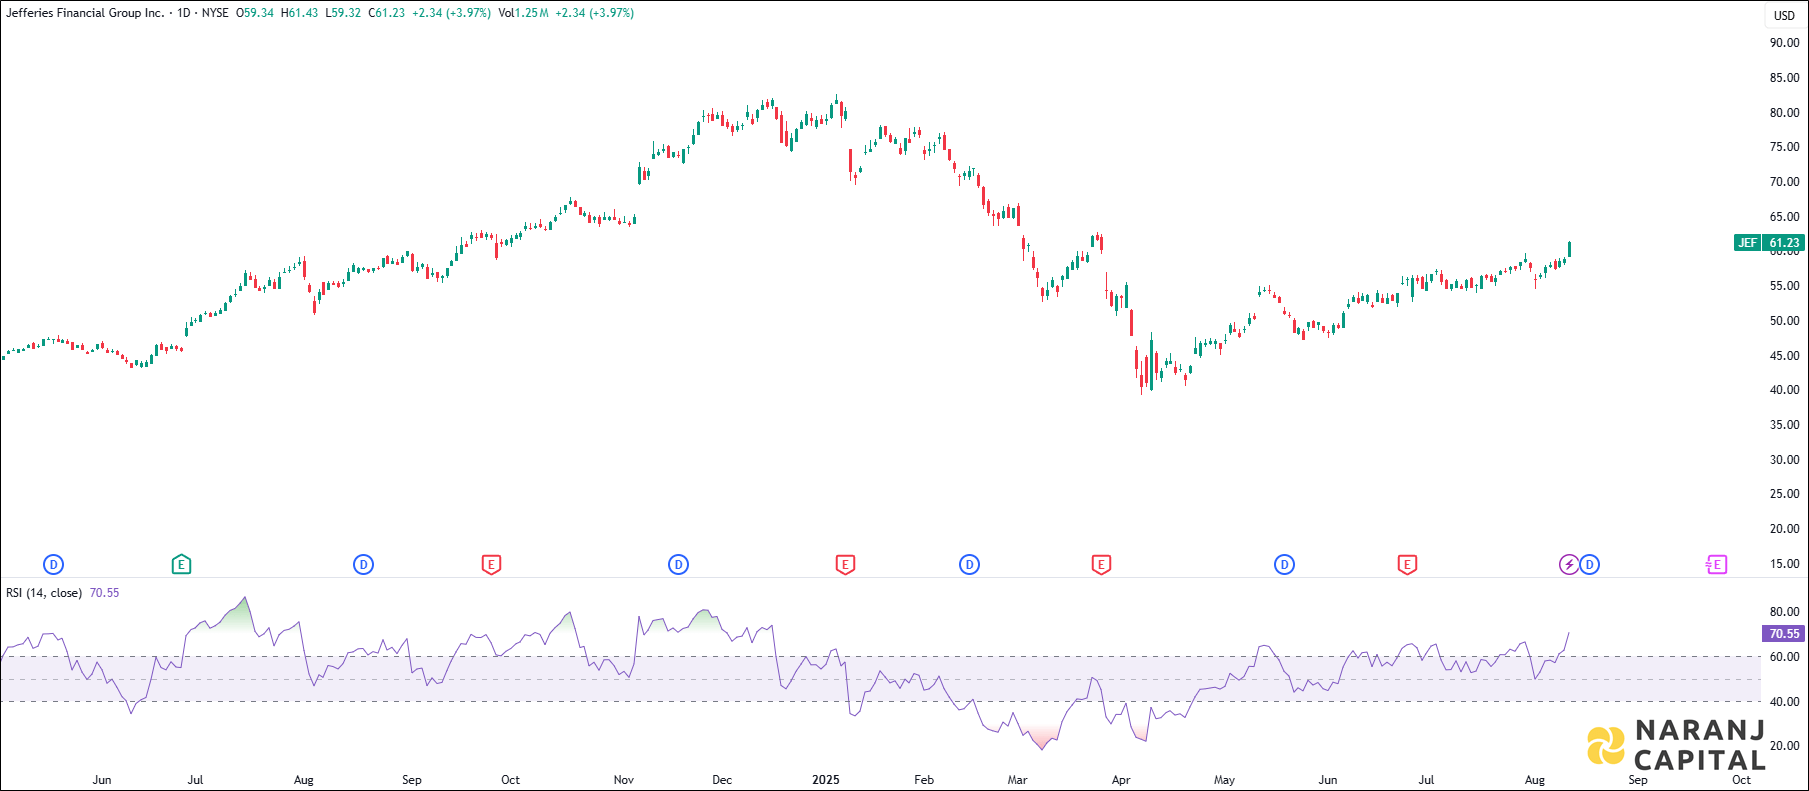
Current RSI of this stock is 70.55, which indicates the strength of buyers.
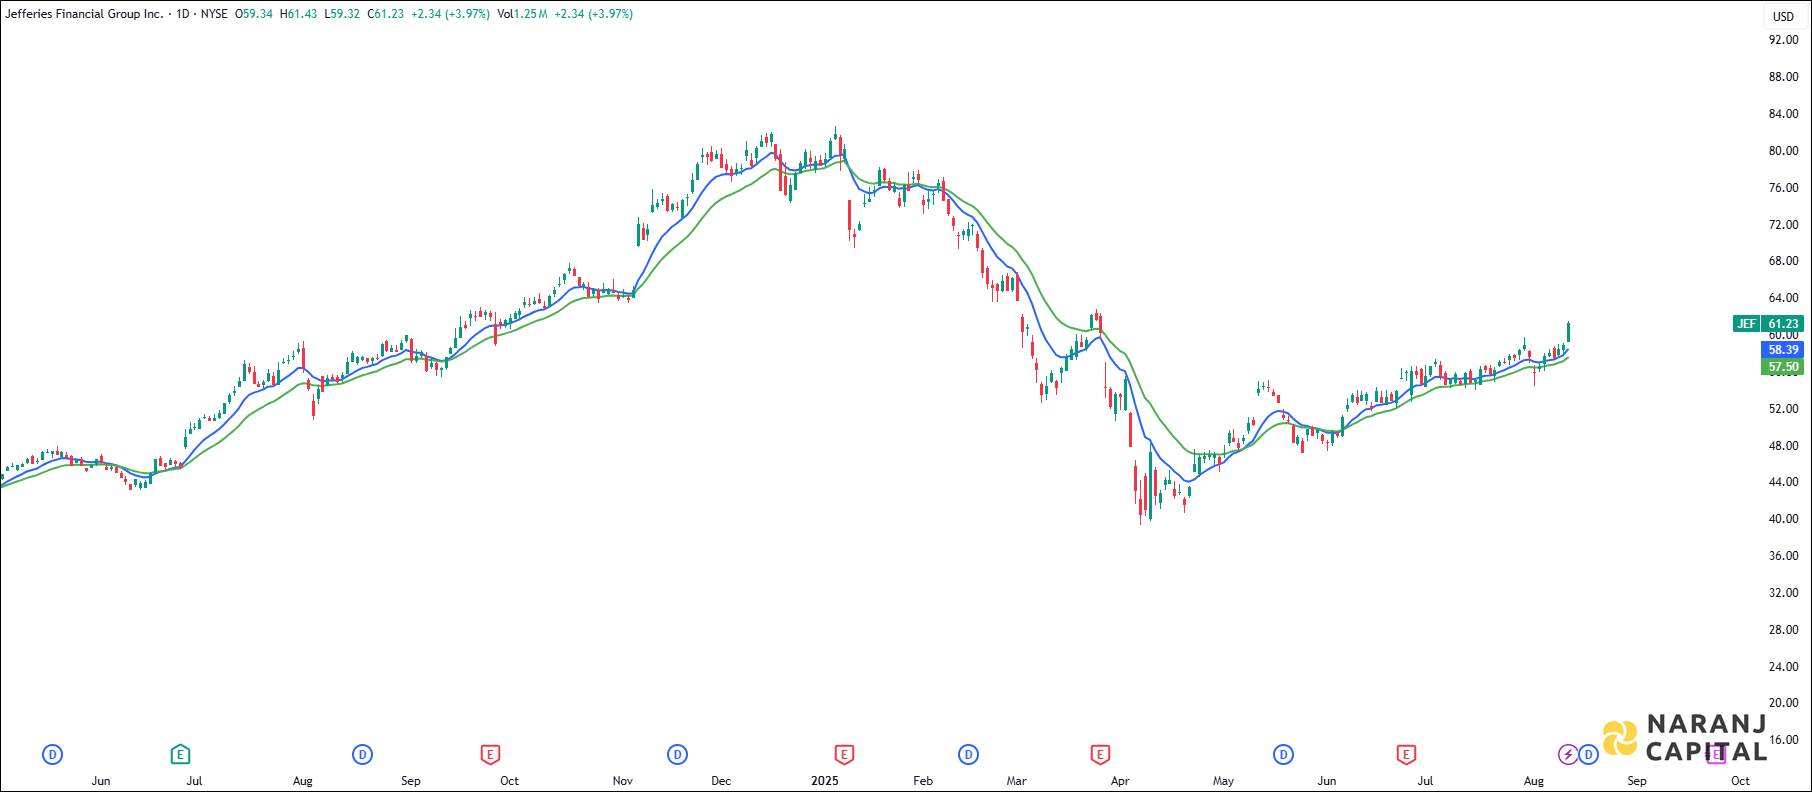
The short length exponential moving average (10 EMA) has crossed the long length exponential moving average (20 EMA) from the below, generates bullish signal. Last day’s candle has closed above all these moving averages. This suggests buyers are taking interest in this stock.
Based on our US stock market recommendations, Jefferies Financial Group stock price target will be USD 75 - USD 78 in the next 5-7 trading sessions.


25% - 28%
5 - 7 months
25% - 28%
5 - 7 months
JEF — NYSE —
Current RSI of this stock is 70.55, which indicates the strength of buyers.
The short length exponential moving average (10 EMA) has crossed the long length exponential moving average (20 EMA) from the below, generates bullish signal. Last day’s candle has closed above all these moving averages. This suggests buyers are taking interest in this stock.
Based on our US stock market recommendations, Jefferies Financial Group stock price target will be USD 75 - USD 78 in the next 5-7 trading sessions.