- Naranj Research Desk
- 🇸🇦 Saudi Stock Market
- 🇺🇸 USA Stock Market


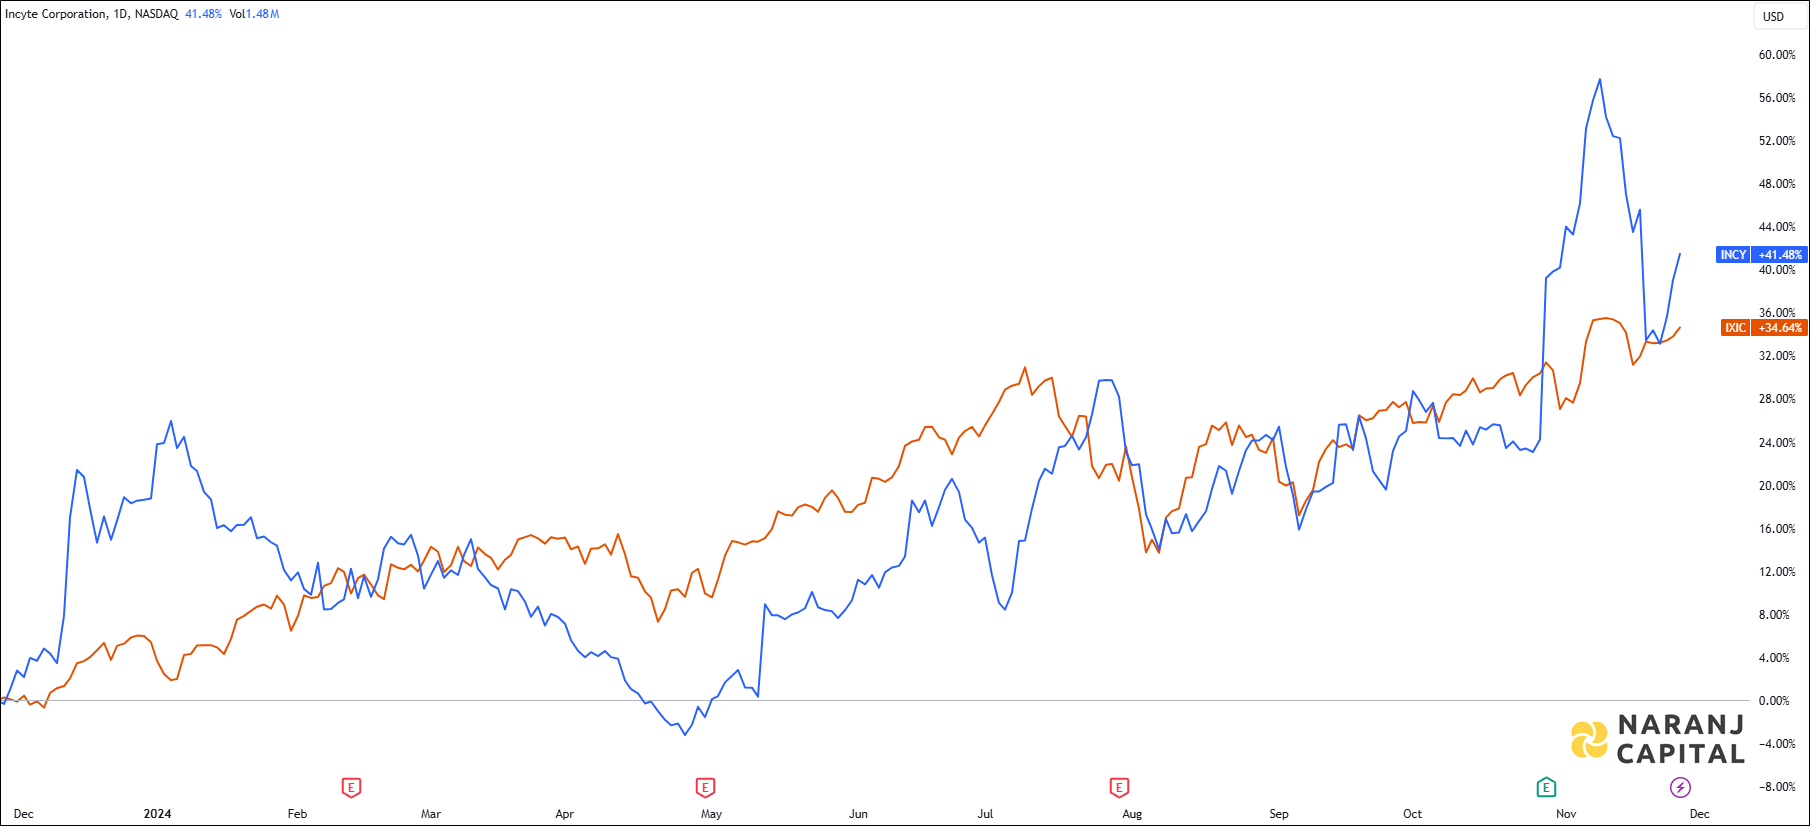
INCY — NASDAQ —
The stock's current RSI stands at 53.40, indicating a rebound from the 40 level, which reflects a favorable market sentiment.
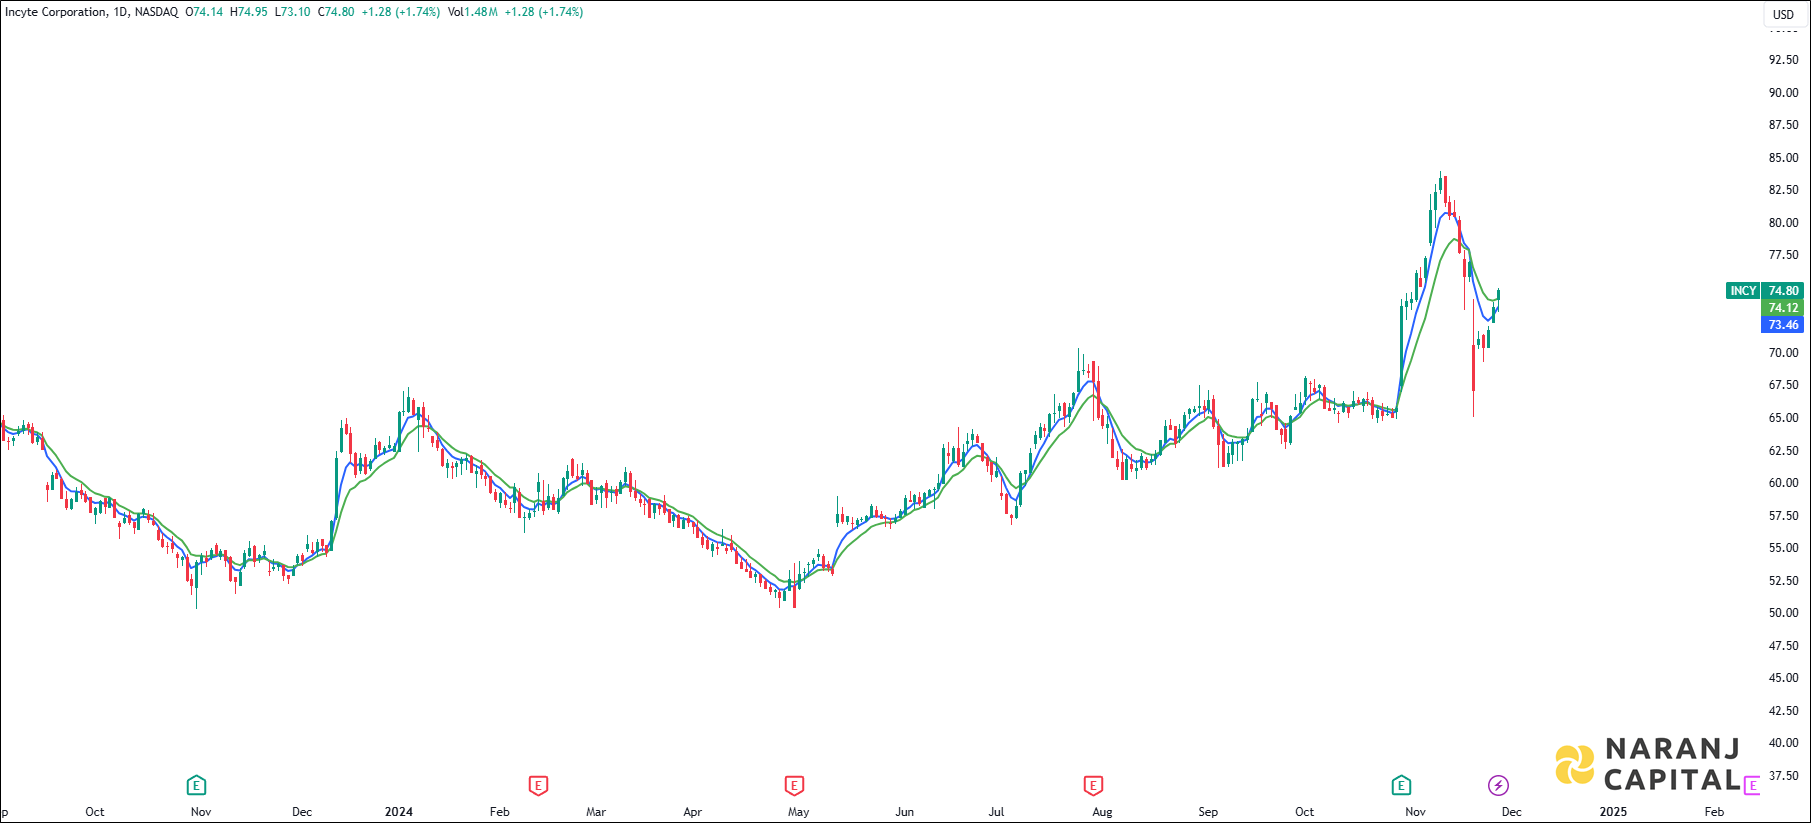
The short length exponential moving average (5 EMA) is about to cross the long length exponential moving average (10 EMA) from the below, generates bullish signal. Last day’s candle has closed above all these moving averages. This suggests buyers are taking interest in this stock.
Based on our US swing trading stocks, Incyte Corporation stock price target will be USD 78.5 - SAR 80 in the next 14-15 trading sessions.


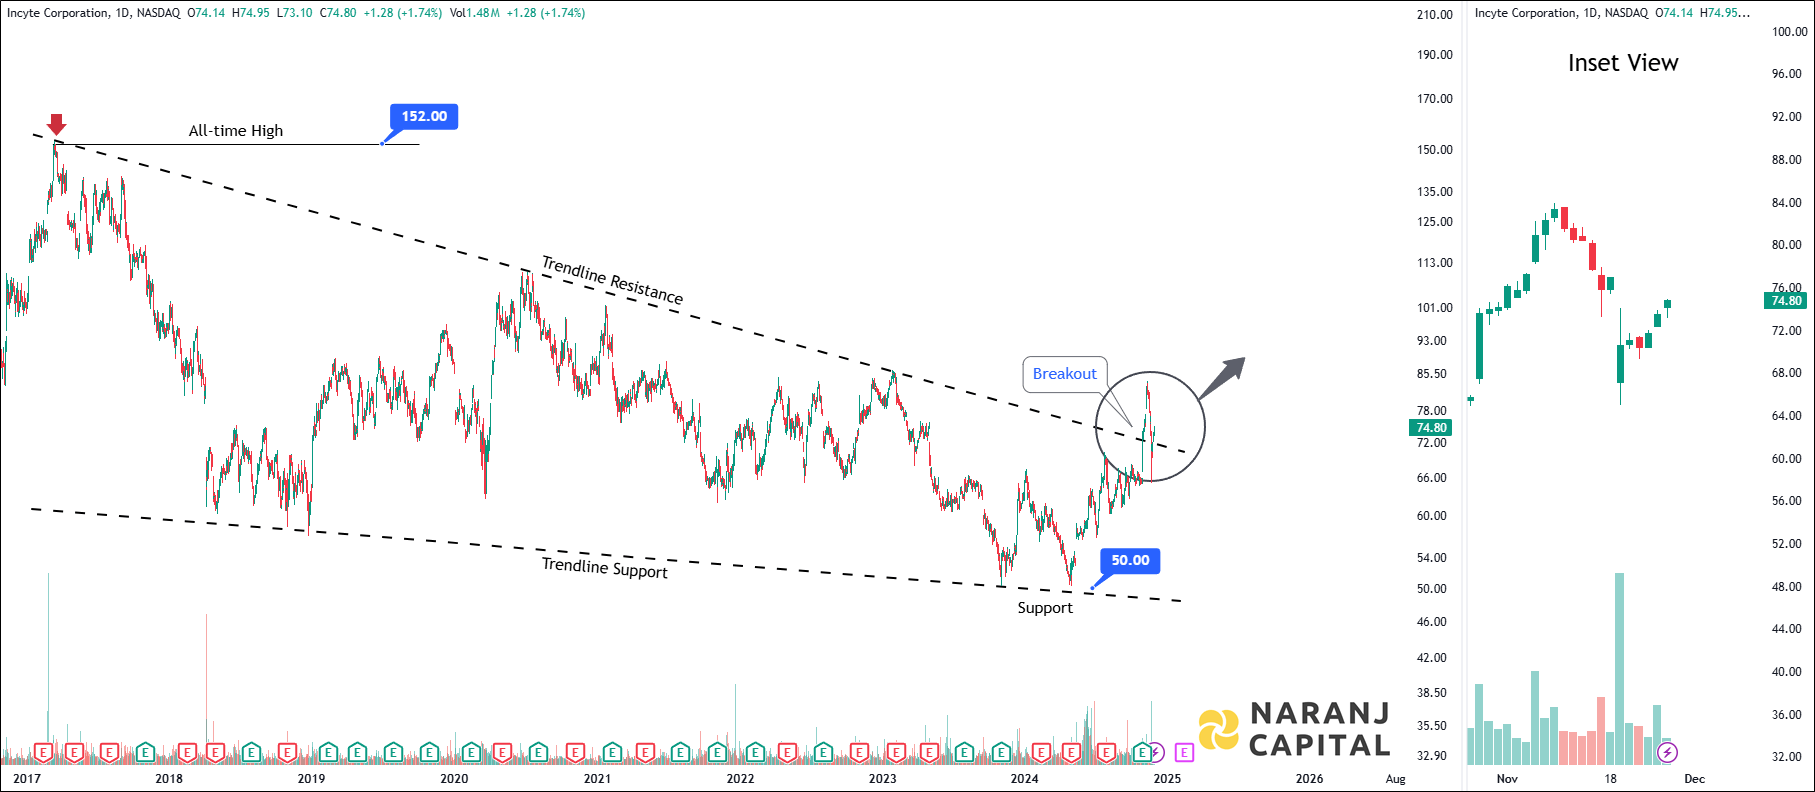
INCY — NASDAQ —
The stock's current RSI stands at 53.40, indicating a rebound from the 40 level, which reflects a favorable market sentiment.
The short length exponential moving average (5 EMA) is about to cross the long length exponential moving average (10 EMA) from the below, generates bullish signal. Last day’s candle has closed above all these moving averages. This suggests buyers are taking interest in this stock.
Based on our US swing trading stocks, Incyte Corporation stock price target will be USD 78.5 - SAR 80 in the next 14-15 trading sessions.