- Naranj Research Desk
- 🇸🇦 Saudi Stock Market
- 🇺🇸 USA Stock Market


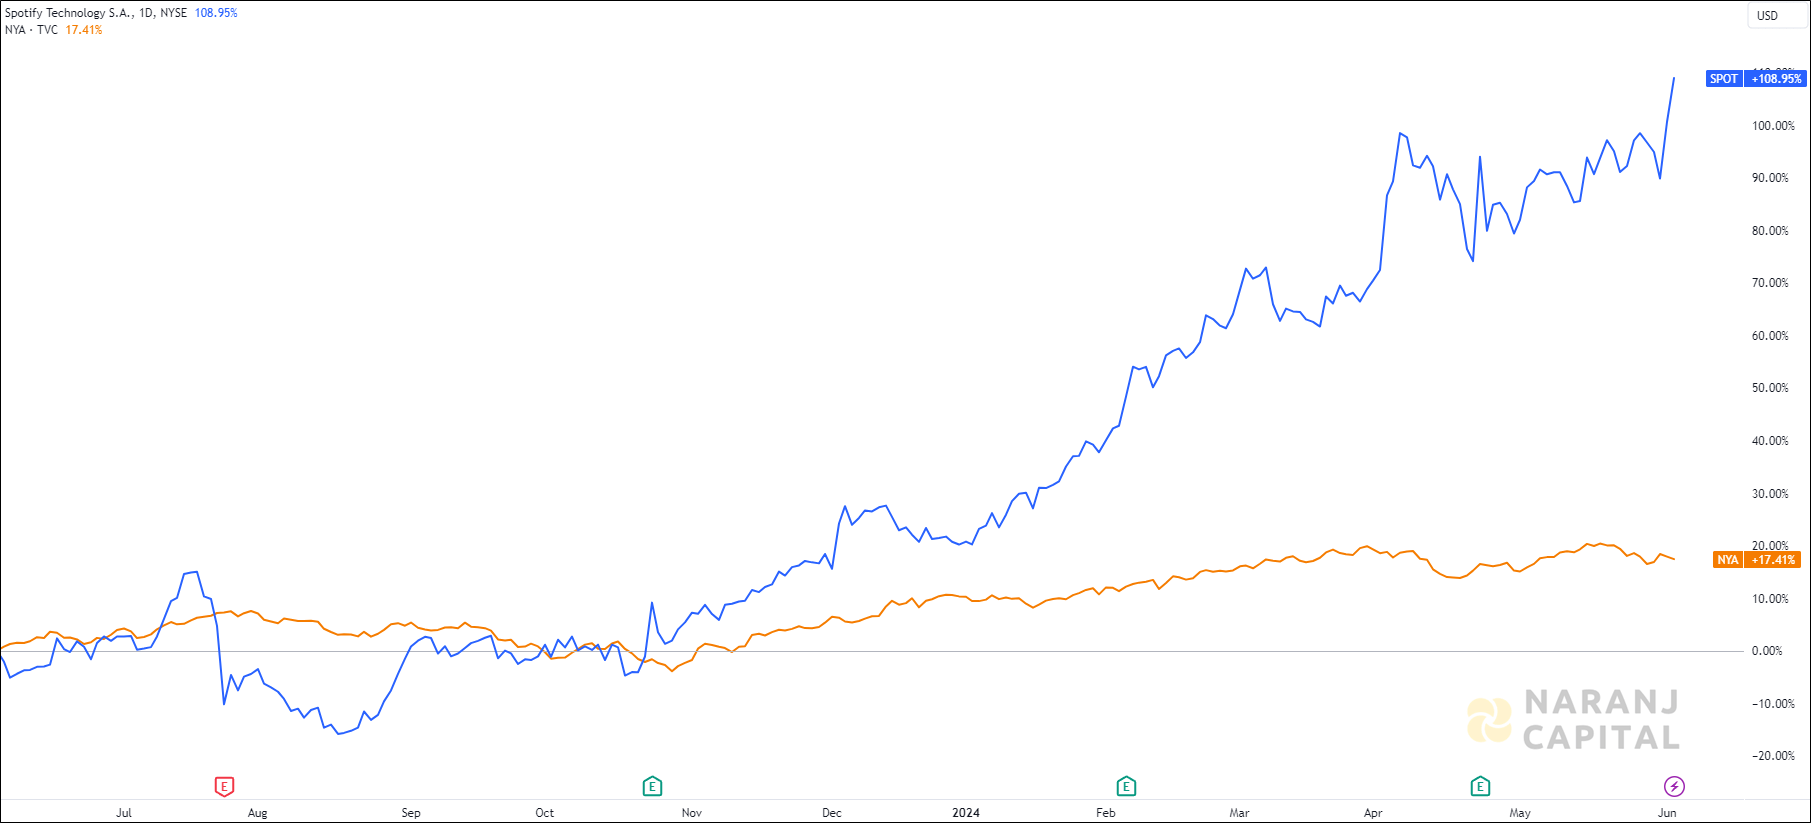
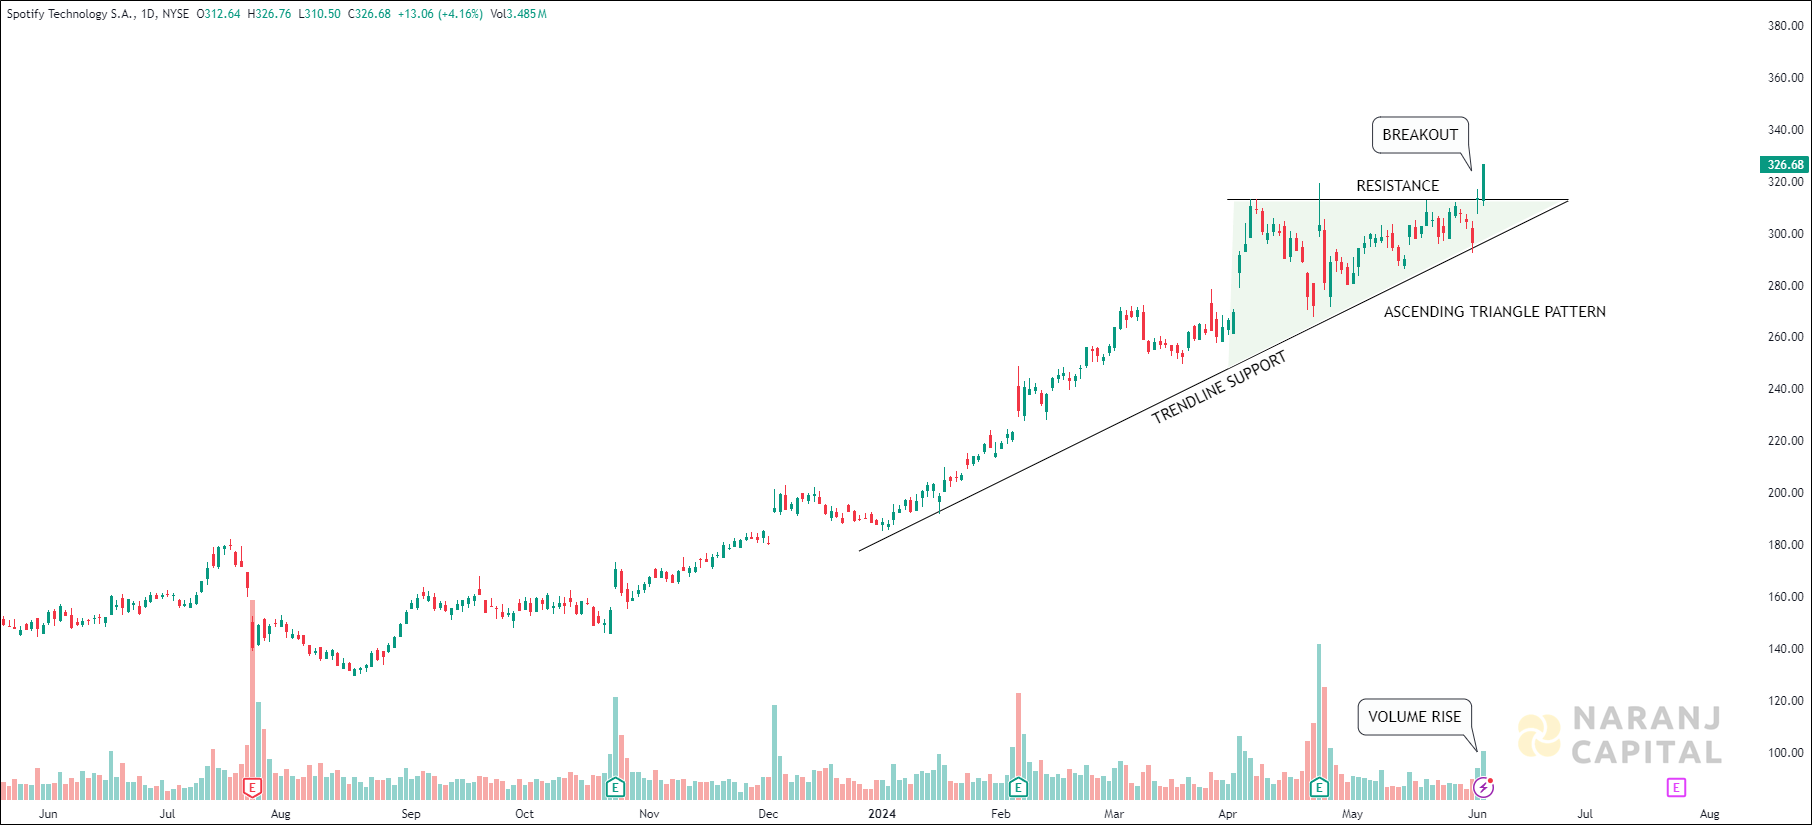
SPOT — NYSE —
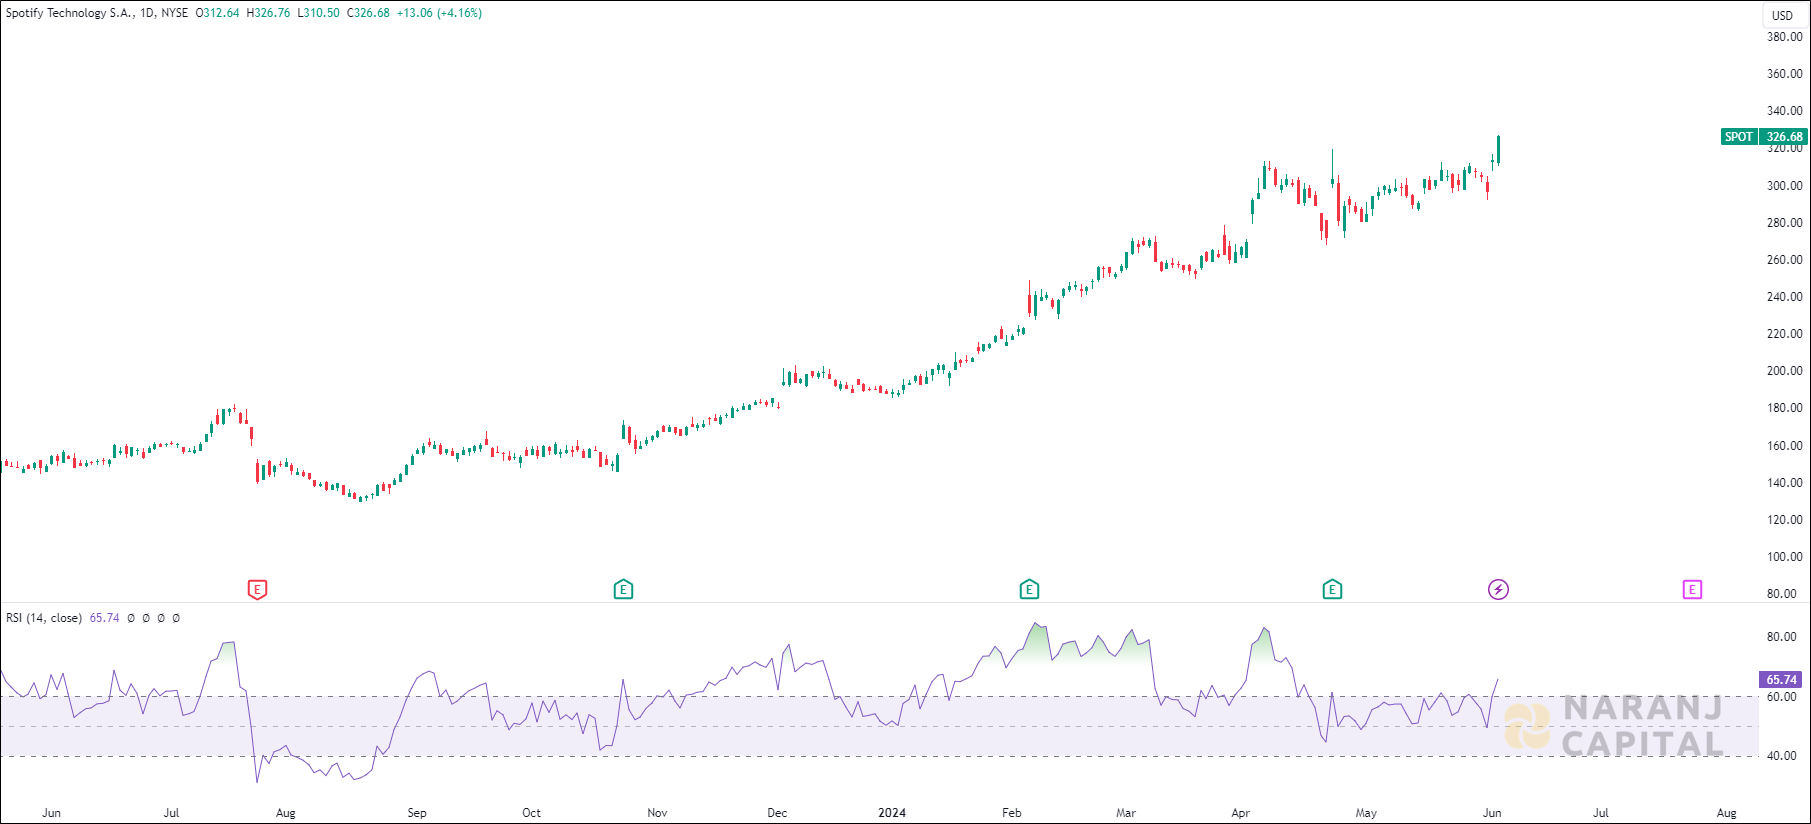
Current RSI of this stock is 65.74, which indicates the strength of buyers.
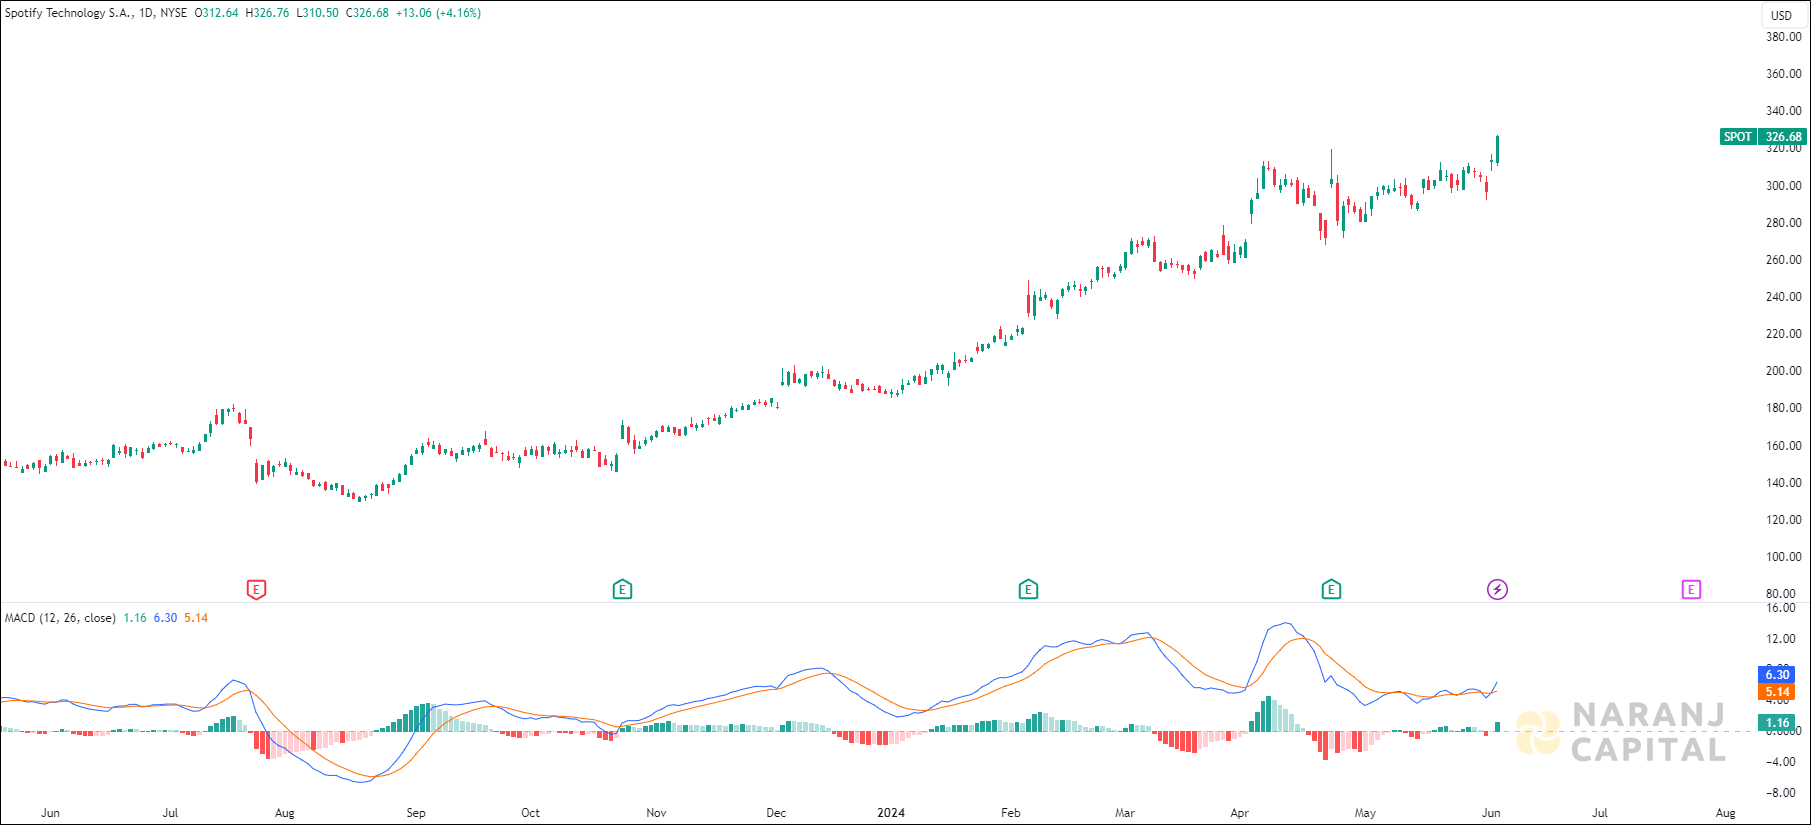
MACD line has just crossed the signal line from the below and a positive histogram chart is forming. This can be considered as a bullish signal.
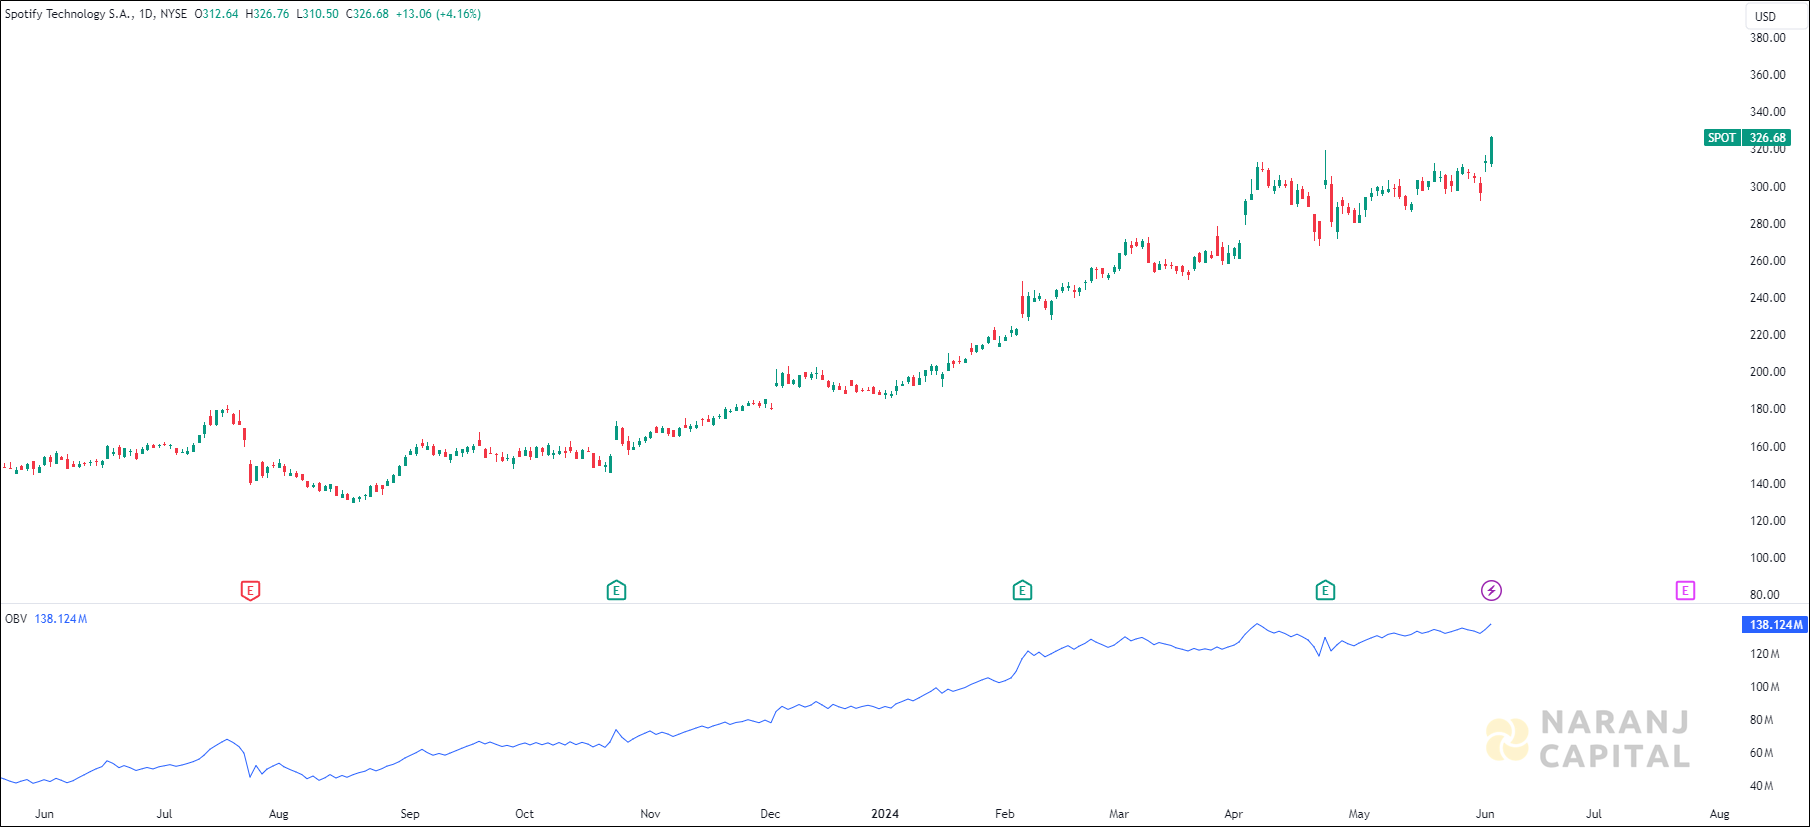
The OBV line is moving in the same upward direction which means there is a positive sentiment in the market. Also the significant price up move accompanying with increasing OBV volume suggests strong buying pressure.
Based on our best swing trading stocks in USA, Spotify Technology stock price target will be USD 345 - USD 350 in the next 14-15 trading sessions.


SPOT — NYSE —
Current RSI of this stock is 65.74, which indicates the strength of buyers.
MACD line has just crossed the signal line from the below and a positive histogram chart is forming. This can be considered as a bullish signal.
The OBV line is moving in the same upward direction which means there is a positive sentiment in the market. Also the significant price up move accompanying with increasing OBV volume suggests strong buying pressure.
Based on our best swing trading stocks in USA, Spotify Technology stock price target will be USD 345 - USD 350 in the next 14-15 trading sessions.