- Naranj Research Desk
- 🇸🇦 Saudi Stock Market
- 🇺🇸 USA Stock Market


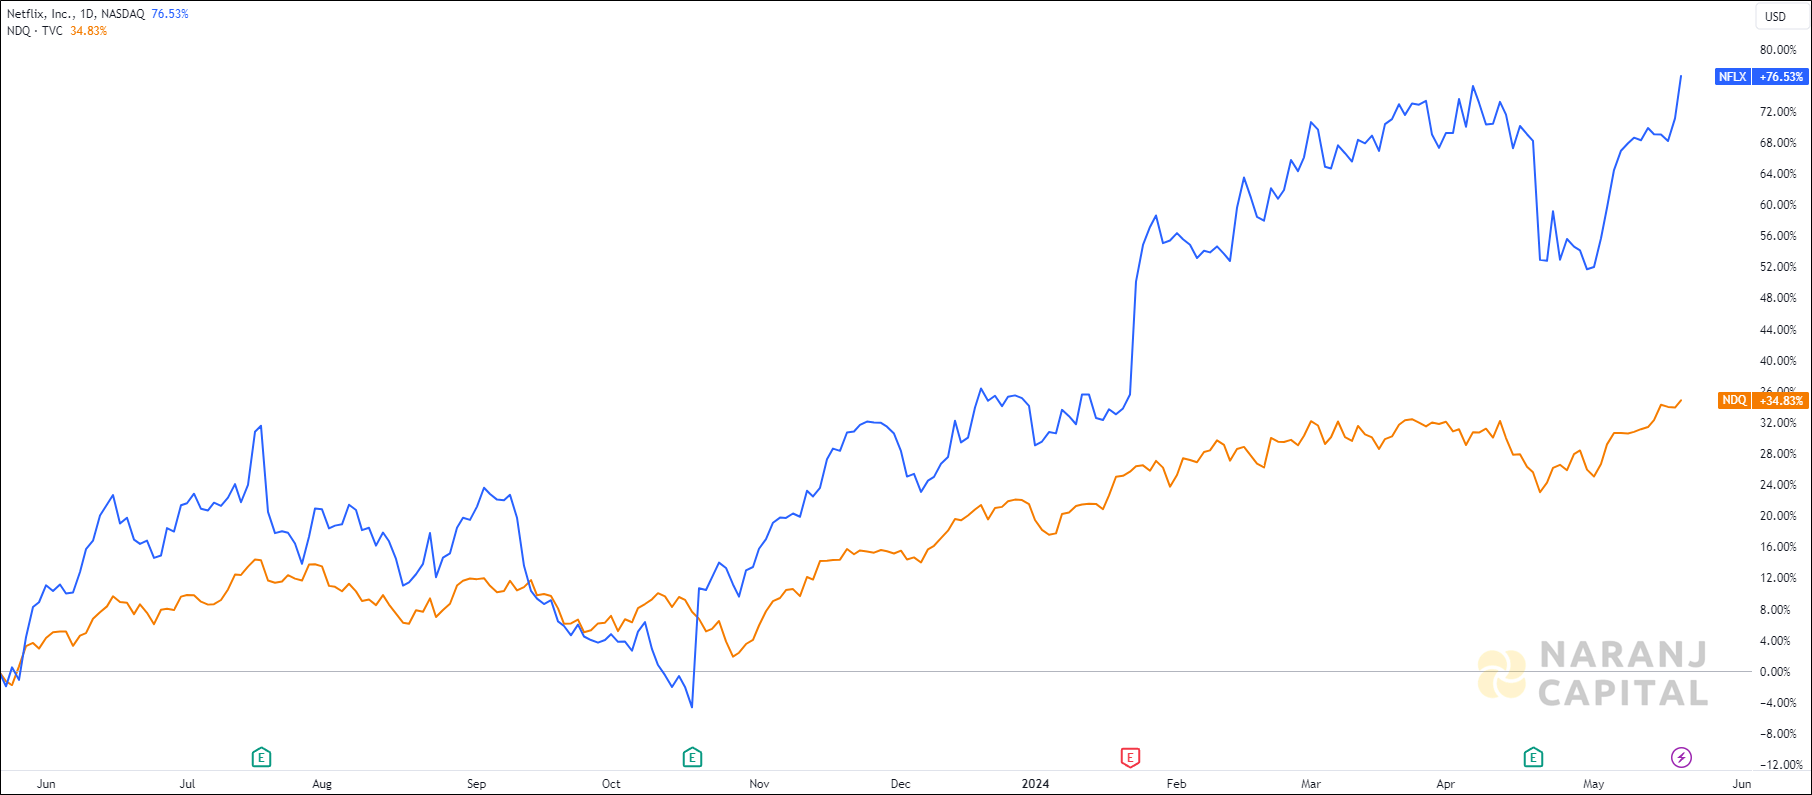
NFLX — NASDAQ —
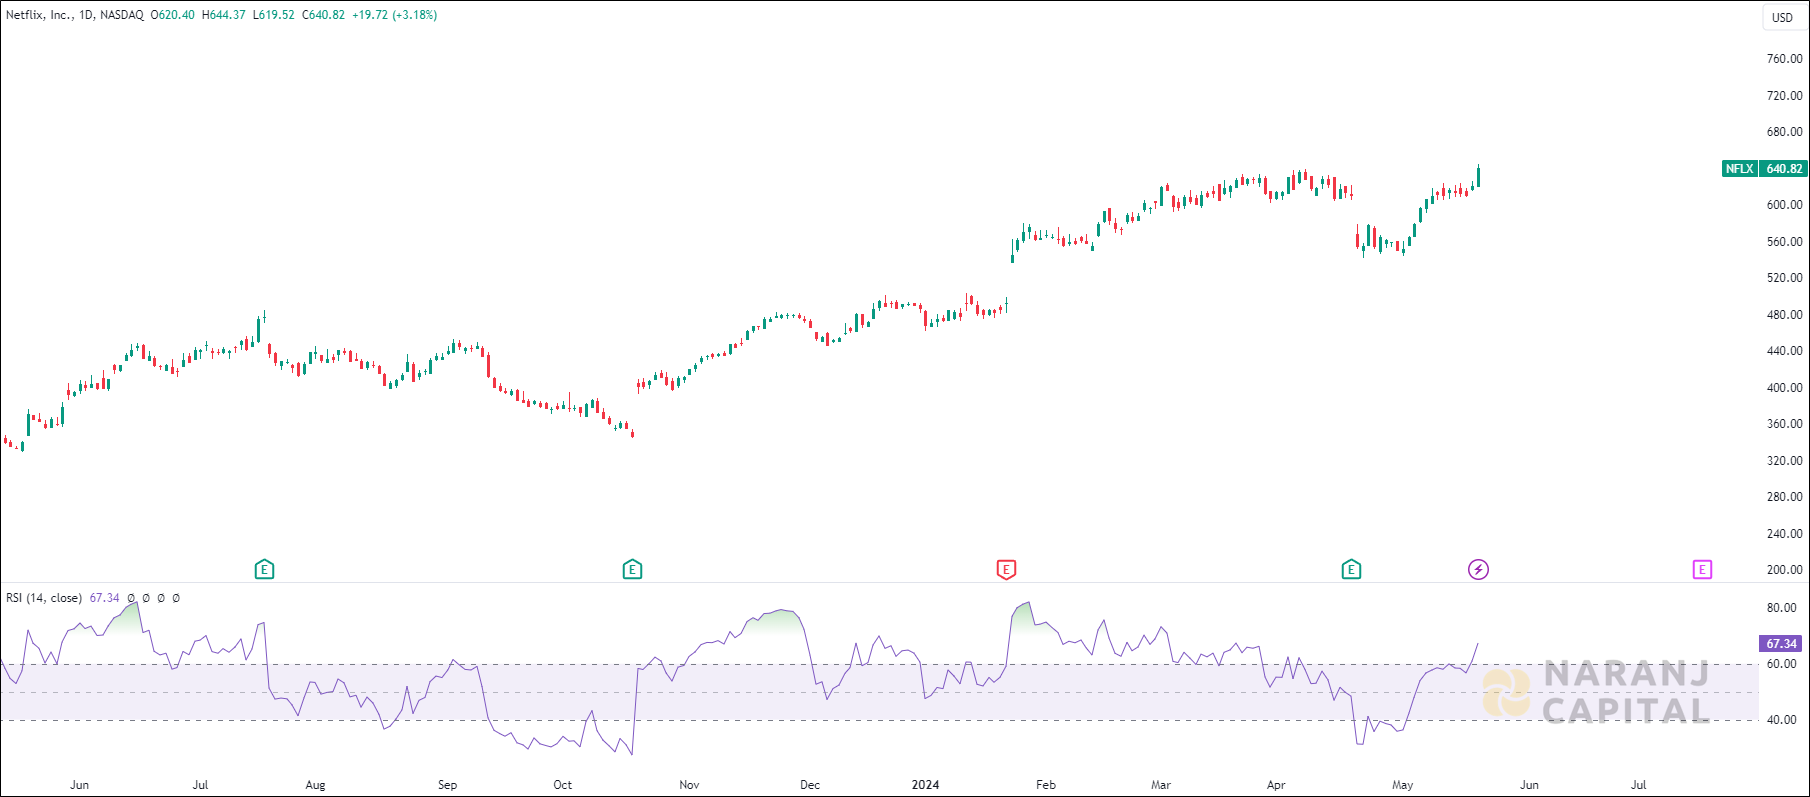
Current RSI of this stock is 67.34, which indicates the strength of buyers.
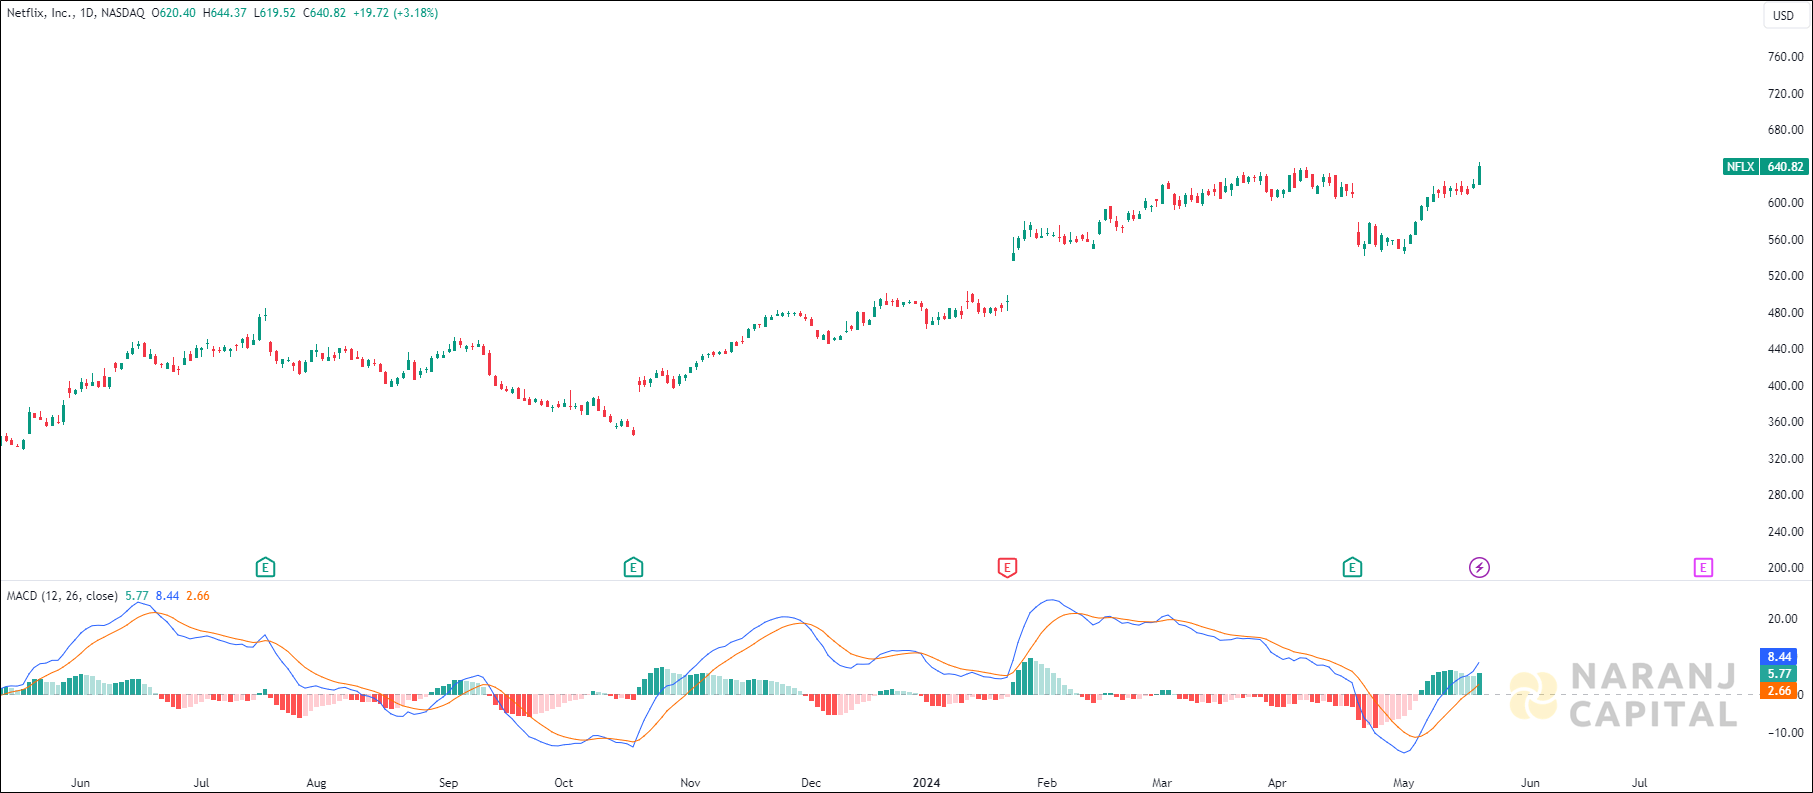
MACD line has just crossed the signal line from the below, generates bullish signal.
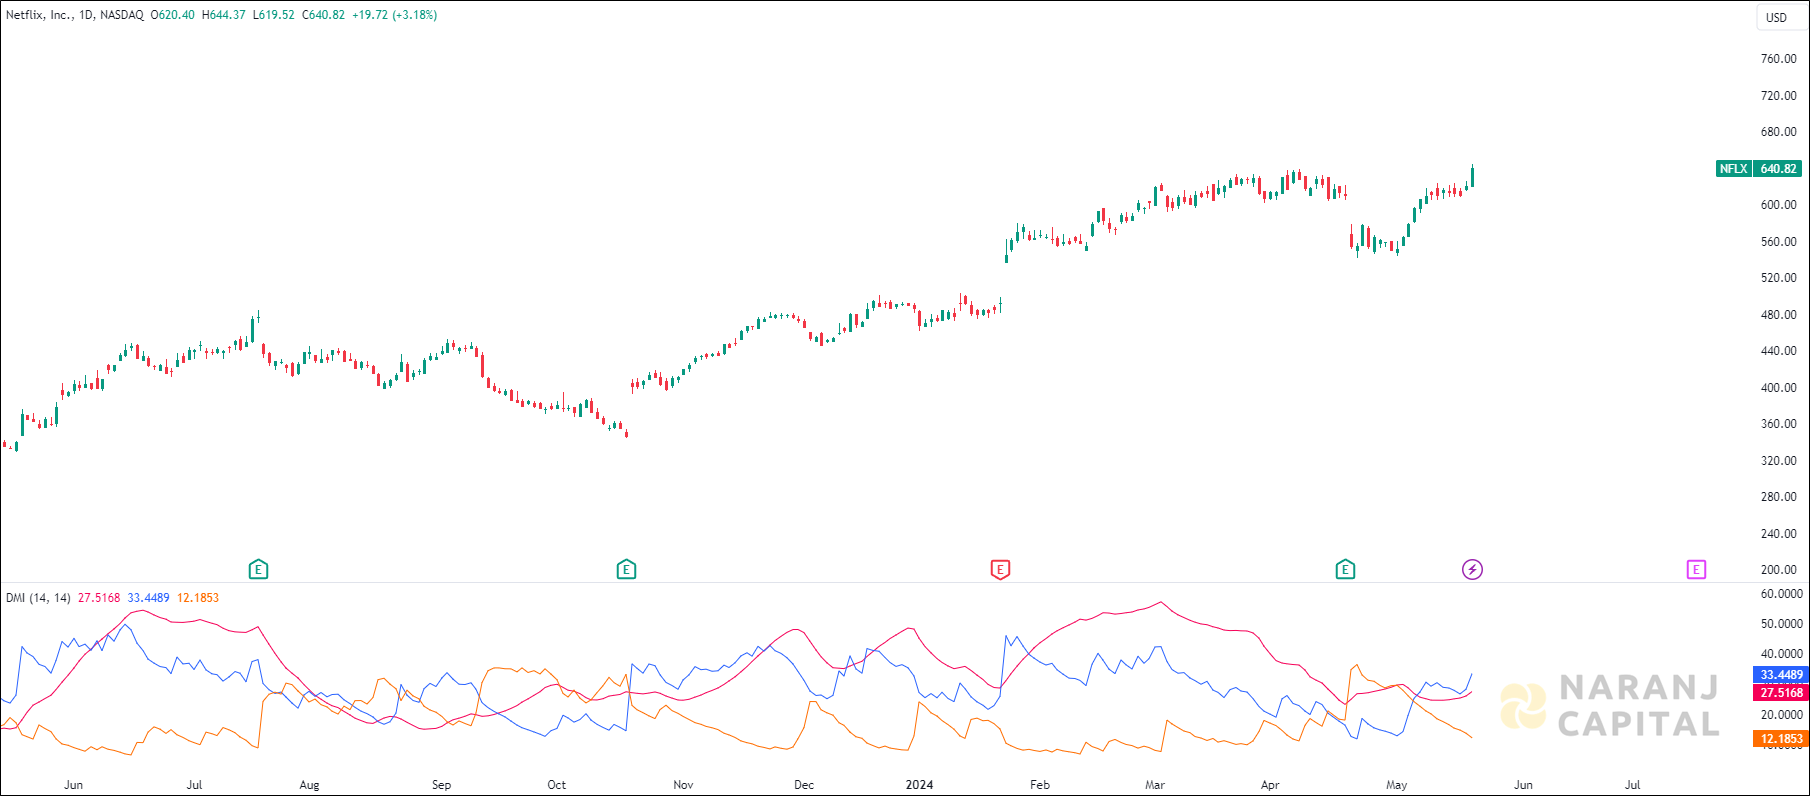
Increasing ADX value above 20, indicated the strength of the trend, thereby uptrending ADX confirms the bullish or bearish supportive decisions. Along with the rising ADX, and the +DI is above (or crossing) -DI, indicates the long trades should be favoured.
Based on our USA swing trading strategies, Netflix stock price target will be USD 670 - USD 680 in the next 15-16 trading sessions.


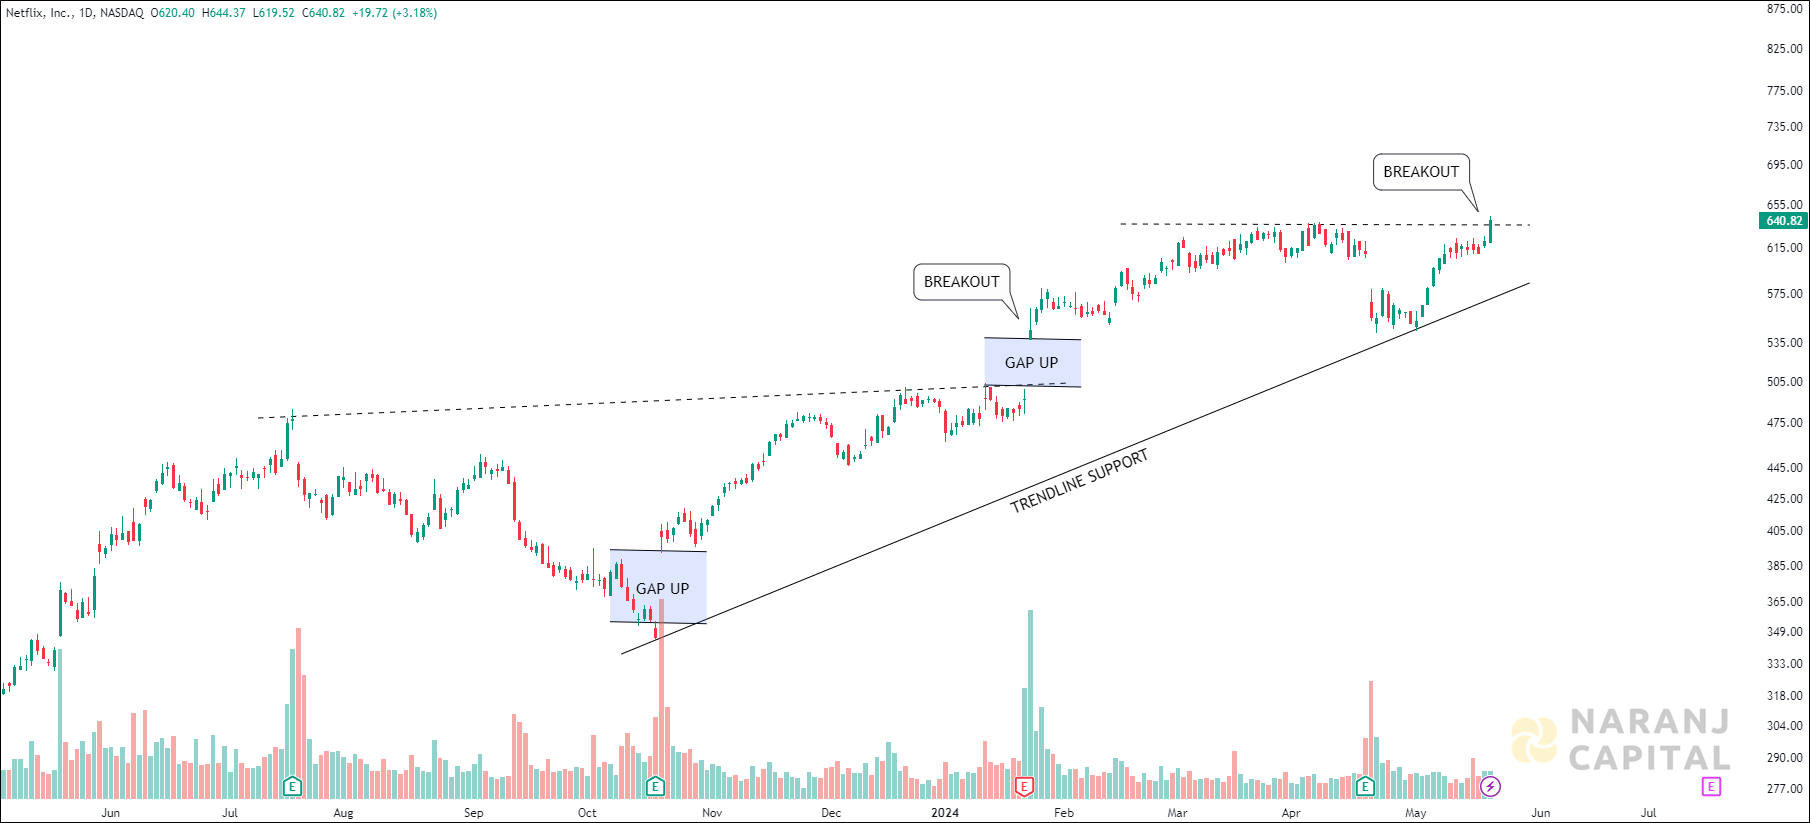
NFLX — NASDAQ —
Current RSI of this stock is 67.34, which indicates the strength of buyers.
MACD line has just crossed the signal line from the below, generates bullish signal.
Increasing ADX value above 20, indicated the strength of the trend, thereby uptrending ADX confirms the bullish or bearish supportive decisions. Along with the rising ADX, and the +DI is above (or crossing) -DI, indicates the long trades should be favoured.
Based on our USA swing trading strategies, Netflix stock price target will be USD 670 - USD 680 in the next 15-16 trading sessions.