- Naranj Research Desk
- 🇸🇦 Saudi Stock Market
- 🇺🇸 USA Stock Market


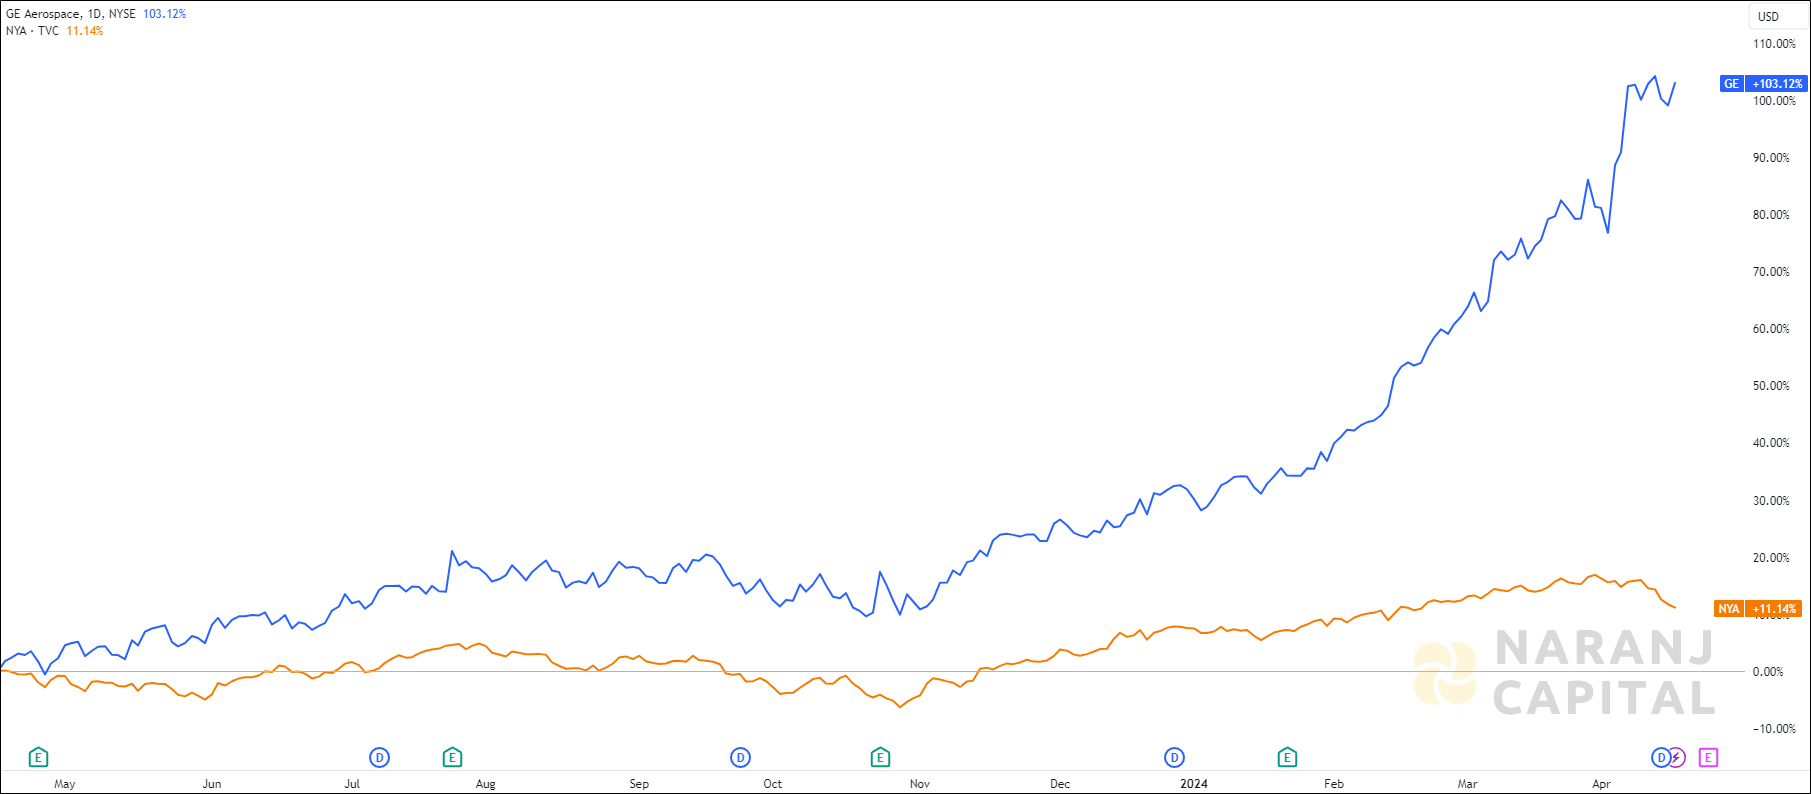
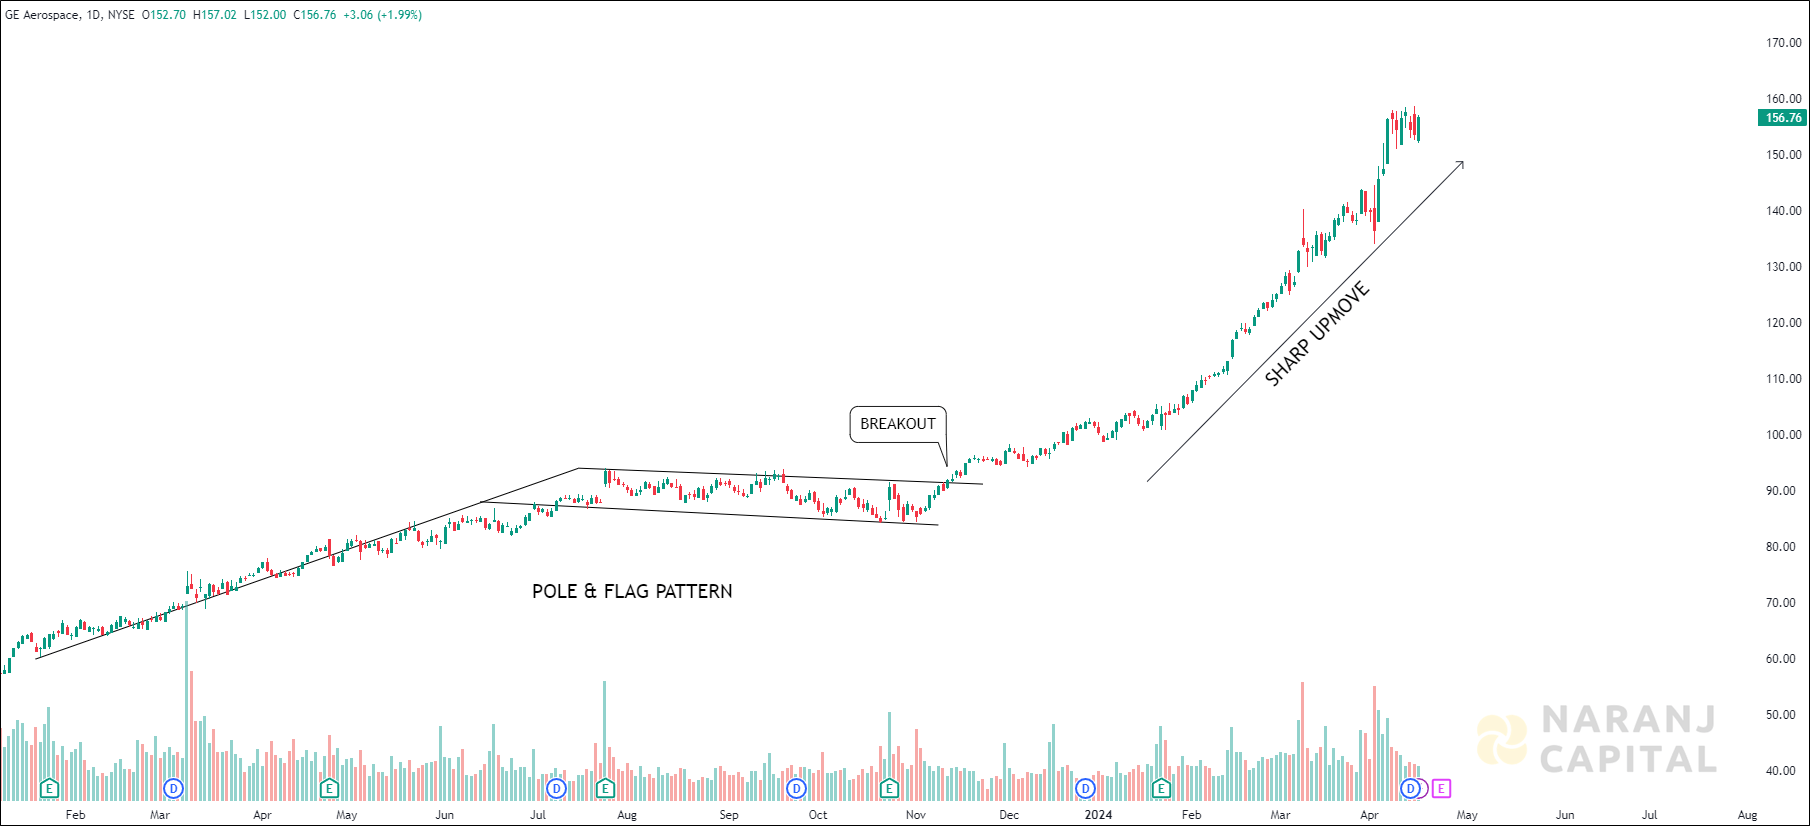
GE — NYSE —
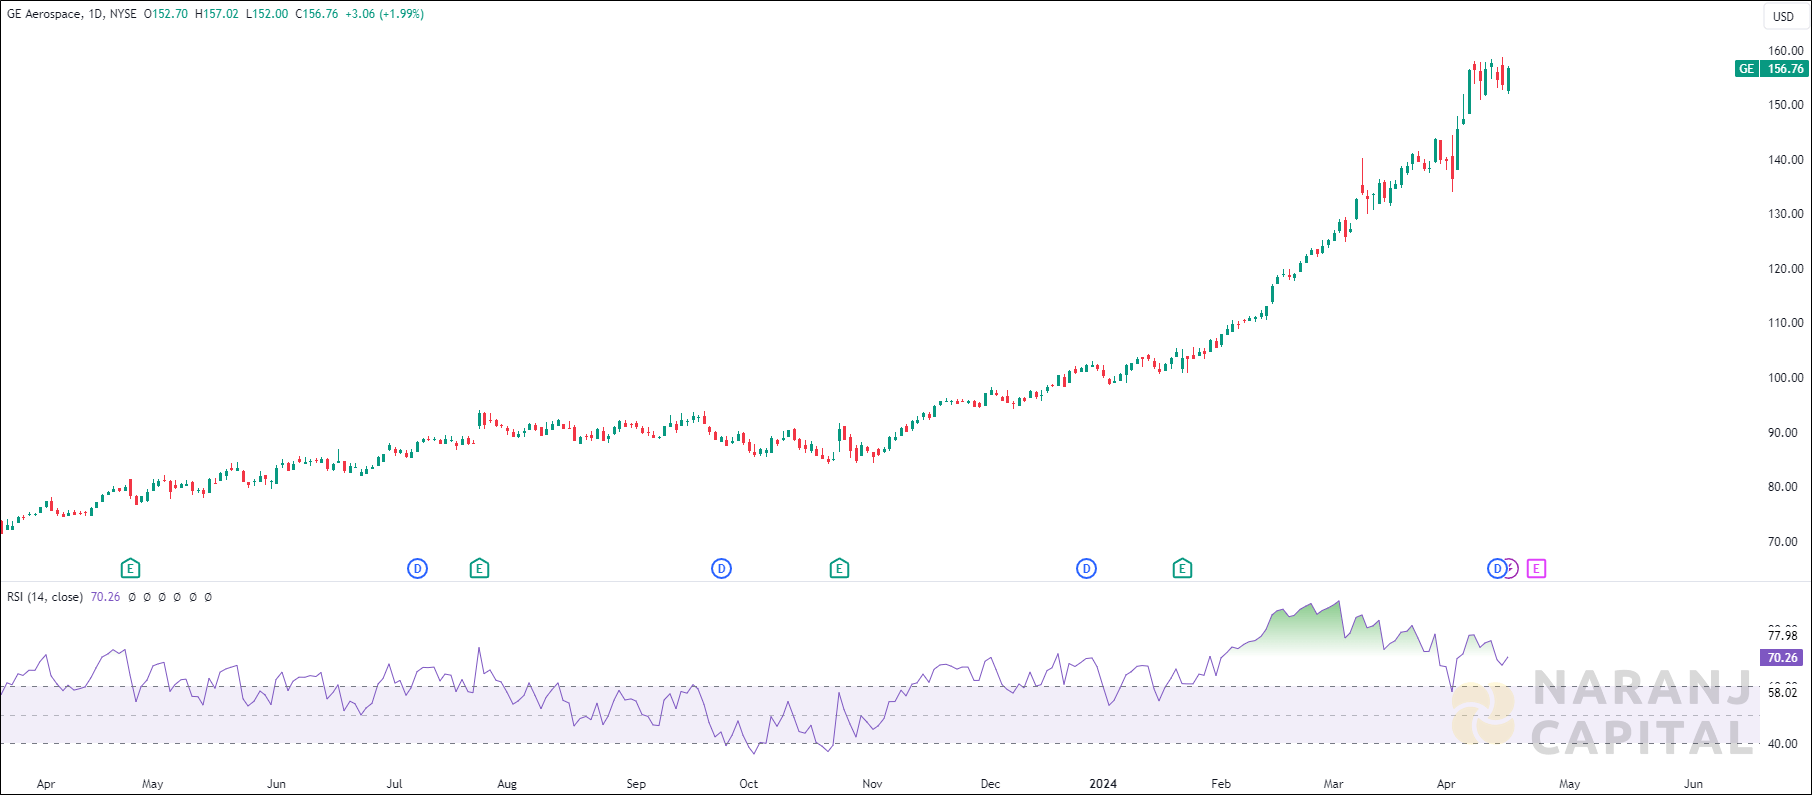
Current RSI of this stock is 70.26, which indicates the strength of buyers.
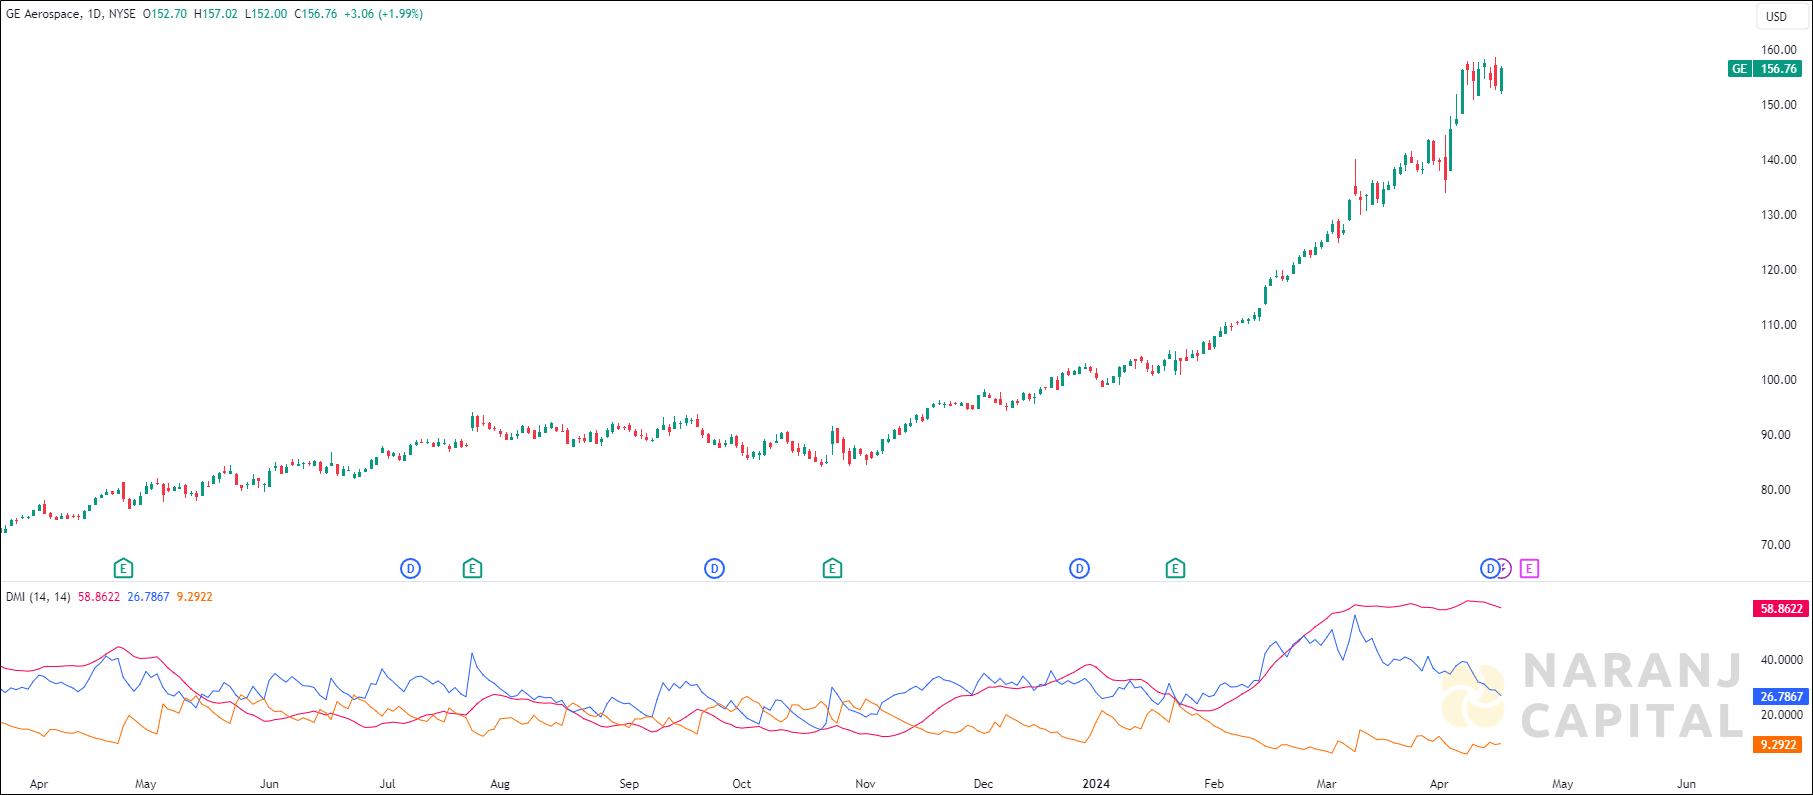
Increasing ADX value above 20, indicated the strength of the trend, thereby uptrending ADX confirms the bullish or bearish supportive decisions. Along with the rising ADX, and the +DI is above (or crossing) -DI, indicates the long trades should be favoured.
The short length moving average (10 SMA) has crossed the long length moving average (20 SMA) from the below, generates bullish signal. Last day’s candle has closed above all these moving averages. This suggests buyers are taking interest in this stock.
Based on our short term trading advice in USA stocks, GE Aerospace stock price target will be USD 163 - USD 166 in the next 12-14 trading sessions.


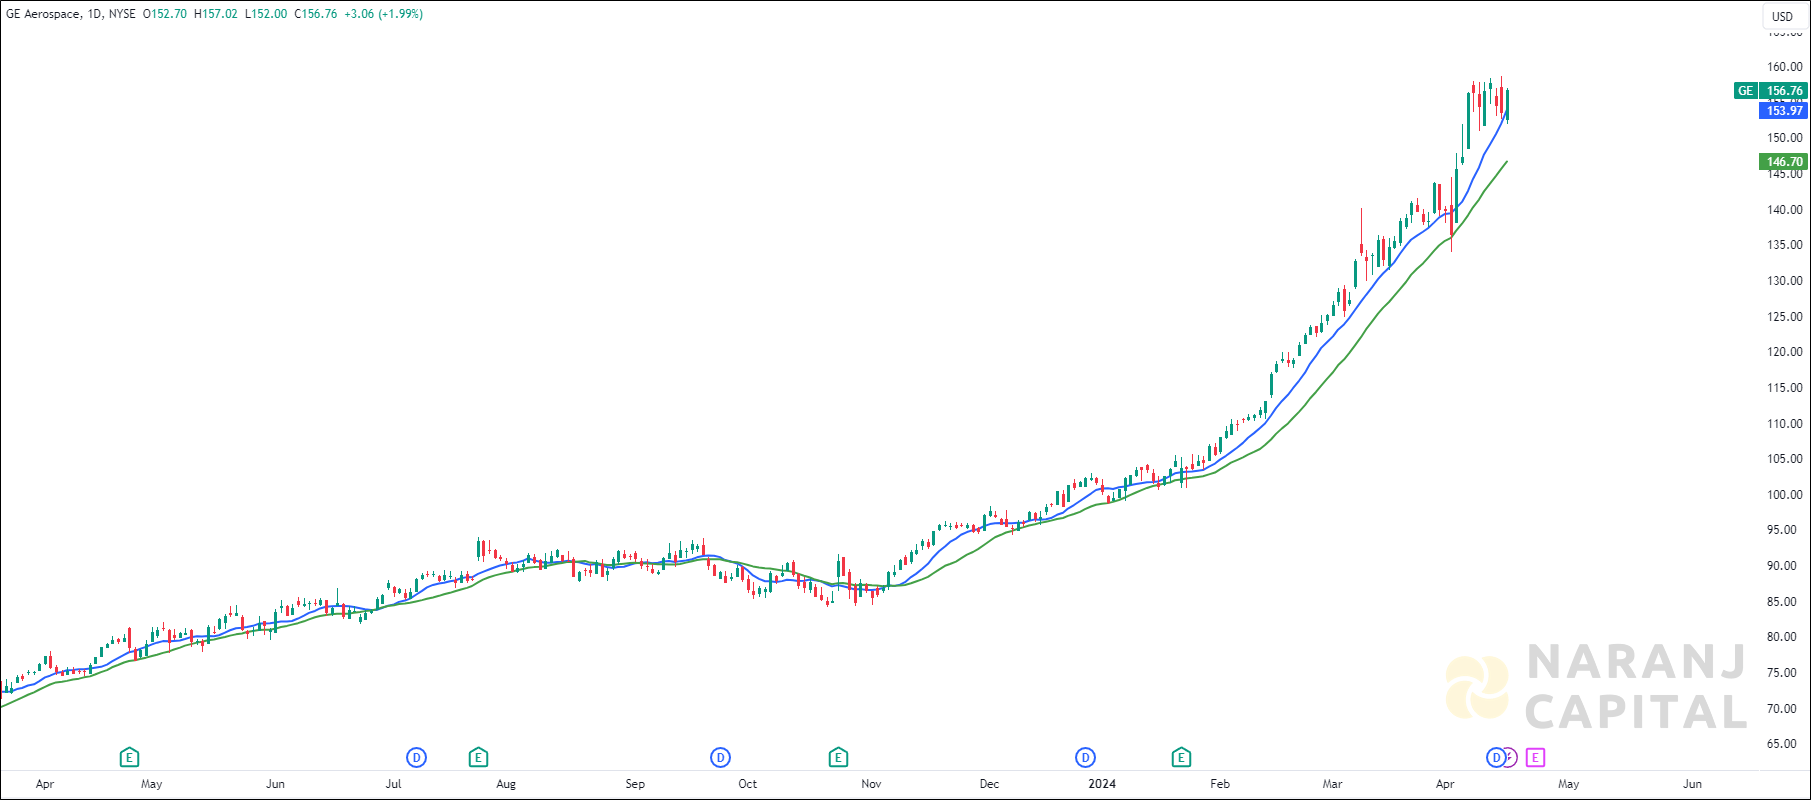
GE — NYSE —
Current RSI of this stock is 70.26, which indicates the strength of buyers.
Increasing ADX value above 20, indicated the strength of the trend, thereby uptrending ADX confirms the bullish or bearish supportive decisions. Along with the rising ADX, and the +DI is above (or crossing) -DI, indicates the long trades should be favoured.
The short length moving average (10 SMA) has crossed the long length moving average (20 SMA) from the below, generates bullish signal. Last day’s candle has closed above all these moving averages. This suggests buyers are taking interest in this stock.
Based on our short term trading advice in USA stocks, GE Aerospace stock price target will be USD 163 - USD 166 in the next 12-14 trading sessions.