- Naranj Research Desk
- 🇸🇦 Saudi Stock Market
- 🇺🇸 USA Stock Market


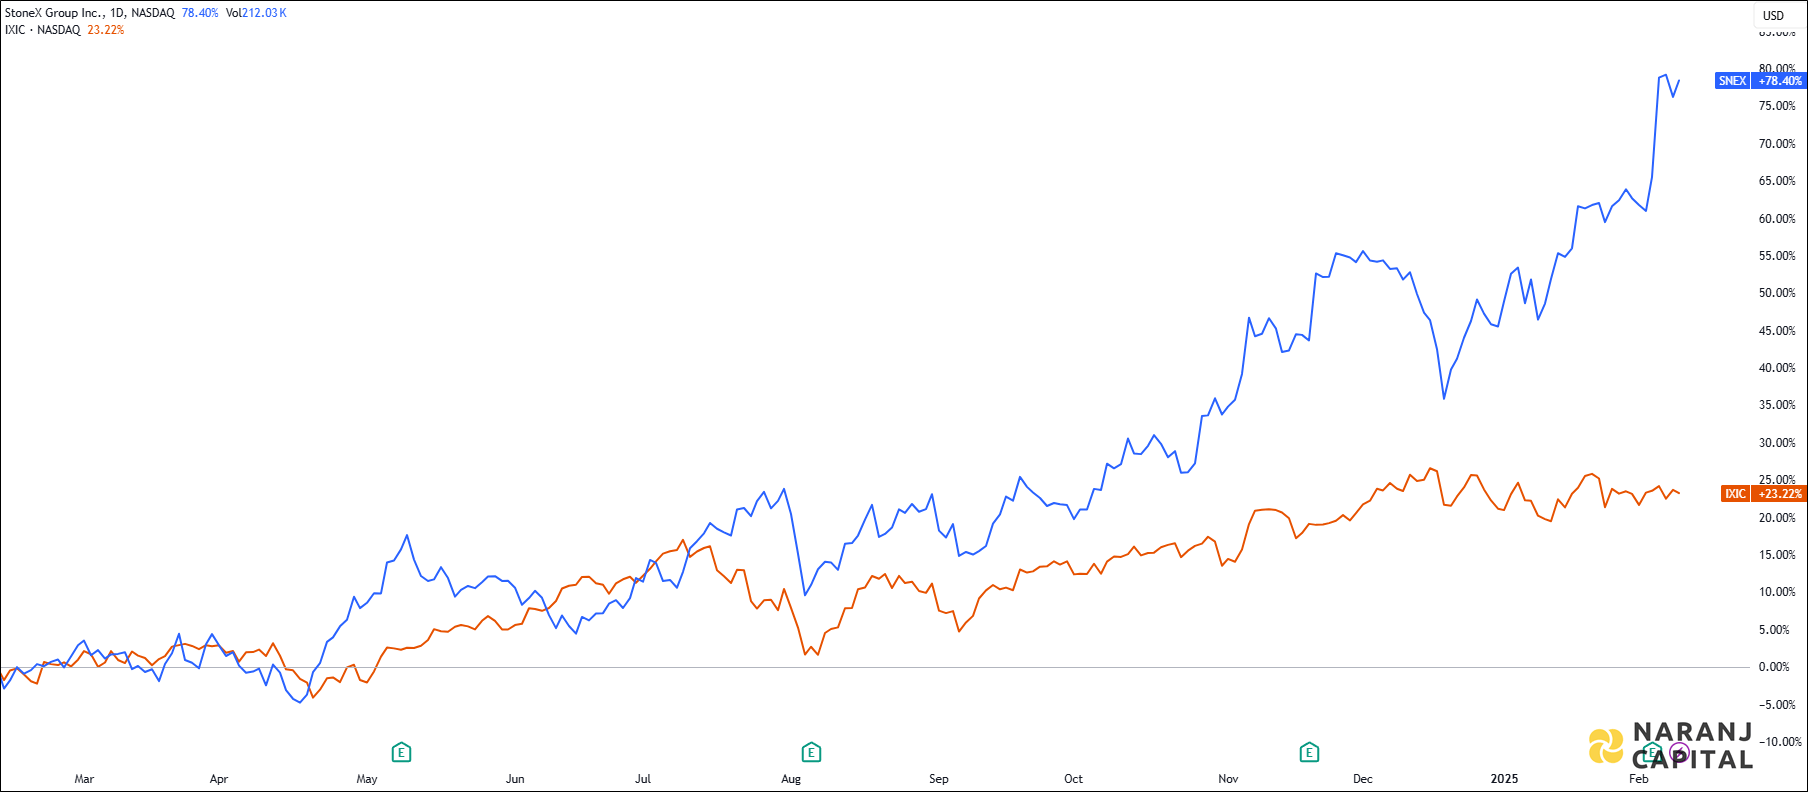
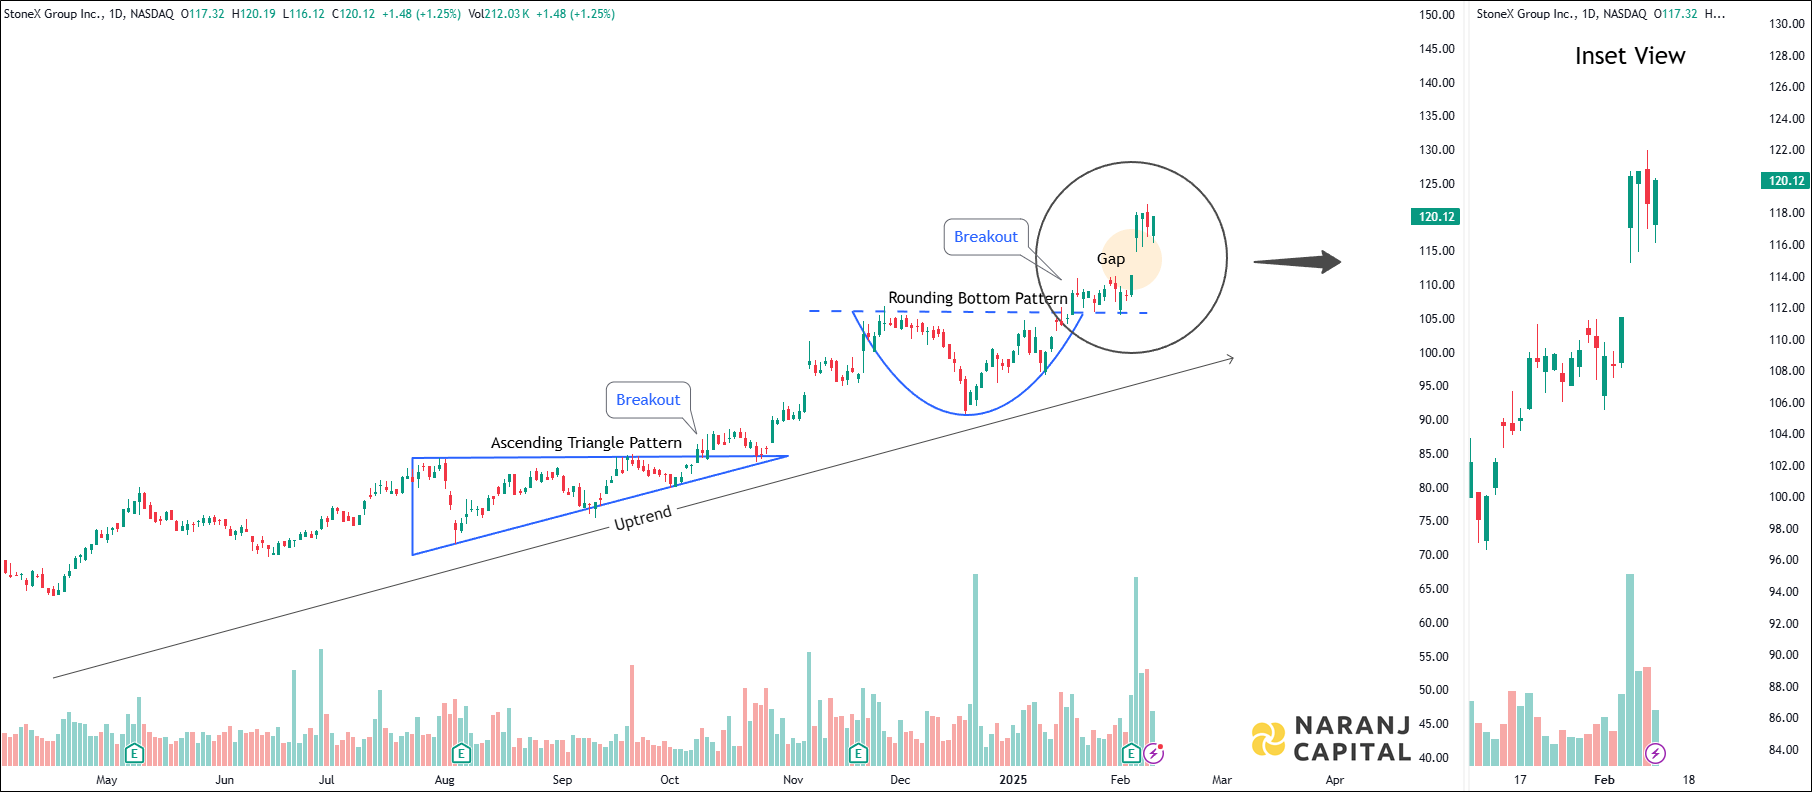
SNEX — NASDAQ —
Current RSI of this stock is 73.26, which indicates the strength of buyers.
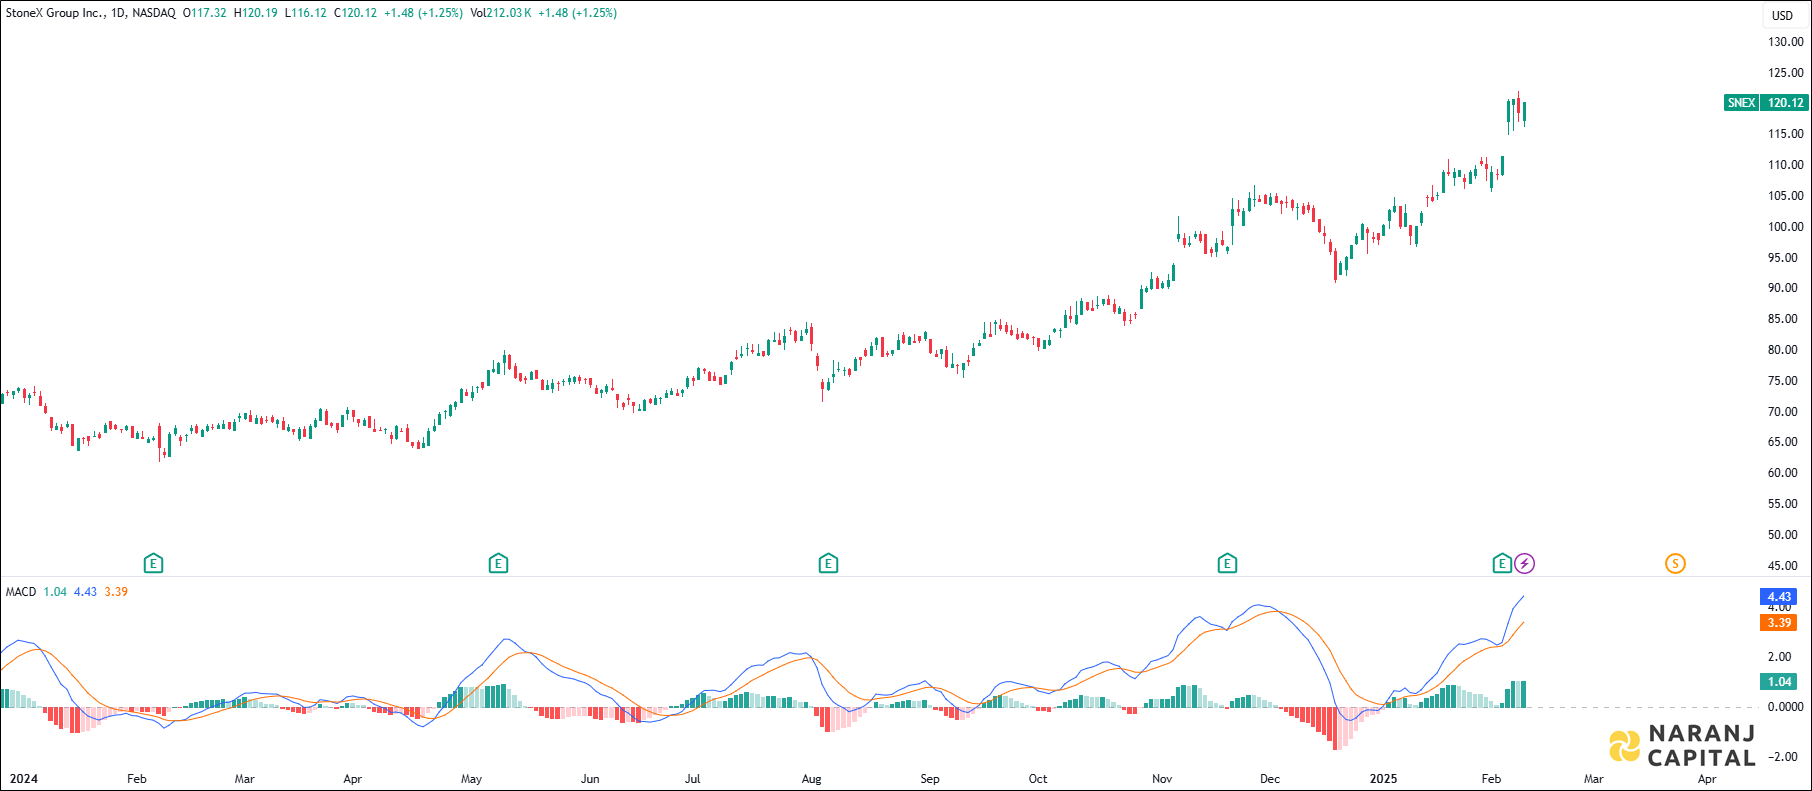
MACD line has just crossed the signal line from the below, generates bullish signal.
The short length exponential moving average (10 EMA) has crossed the long length exponential moving average (20 EMA) from the below, generates bullish signal. Last day’s candle has closed above all these moving averages. This suggests buyers are taking interest in this stock.
Based on our short term swing trade stocks in USA, StoneX Group stock price target will be USD 126 - USD 128 in the next 14-15 trading sessions.


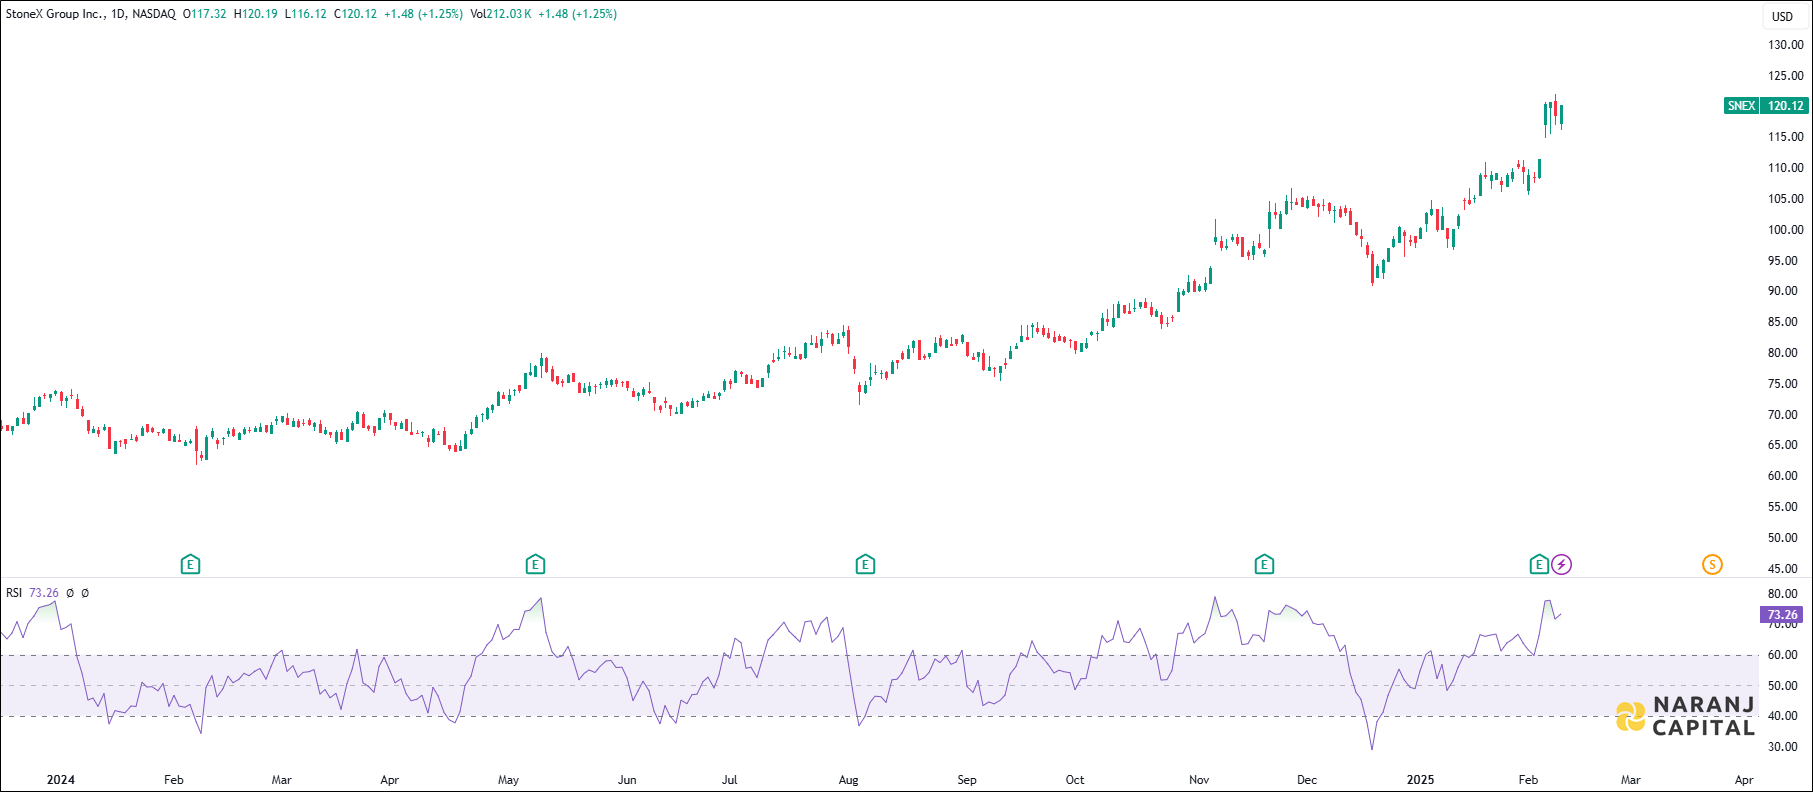
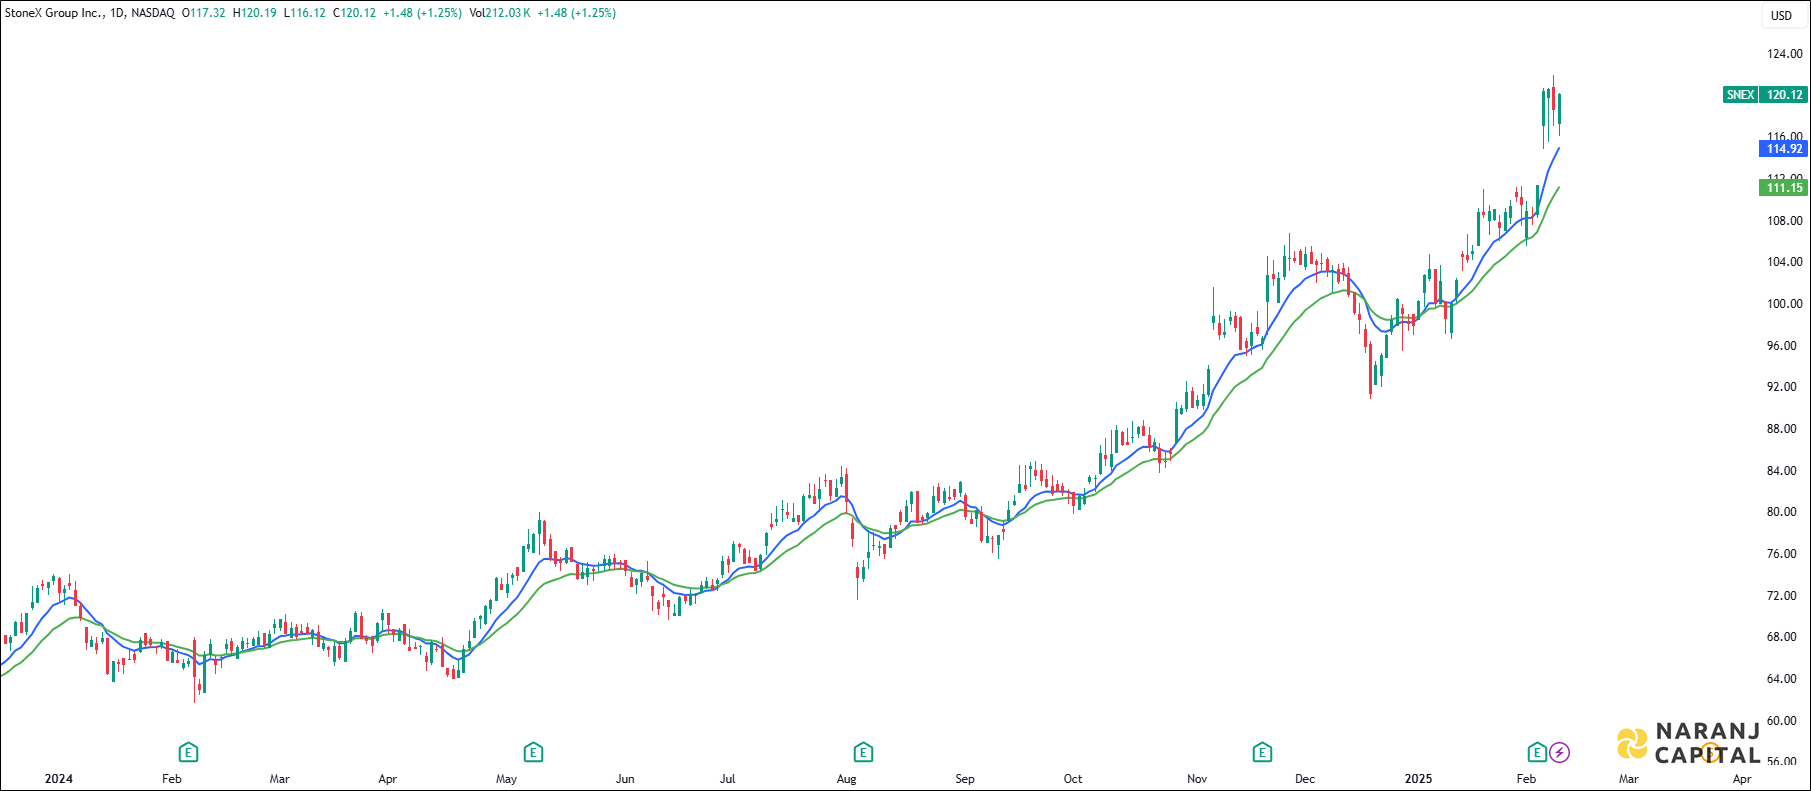
SNEX — NASDAQ —
Current RSI of this stock is 73.26, which indicates the strength of buyers.
MACD line has just crossed the signal line from the below, generates bullish signal.
The short length exponential moving average (10 EMA) has crossed the long length exponential moving average (20 EMA) from the below, generates bullish signal. Last day’s candle has closed above all these moving averages. This suggests buyers are taking interest in this stock.
Based on our short term swing trade stocks in USA, StoneX Group stock price target will be USD 126 - USD 128 in the next 14-15 trading sessions.