- Naranj Research Desk
- 🇸🇦 Saudi Stock Market
- 🇺🇸 USA Stock Market


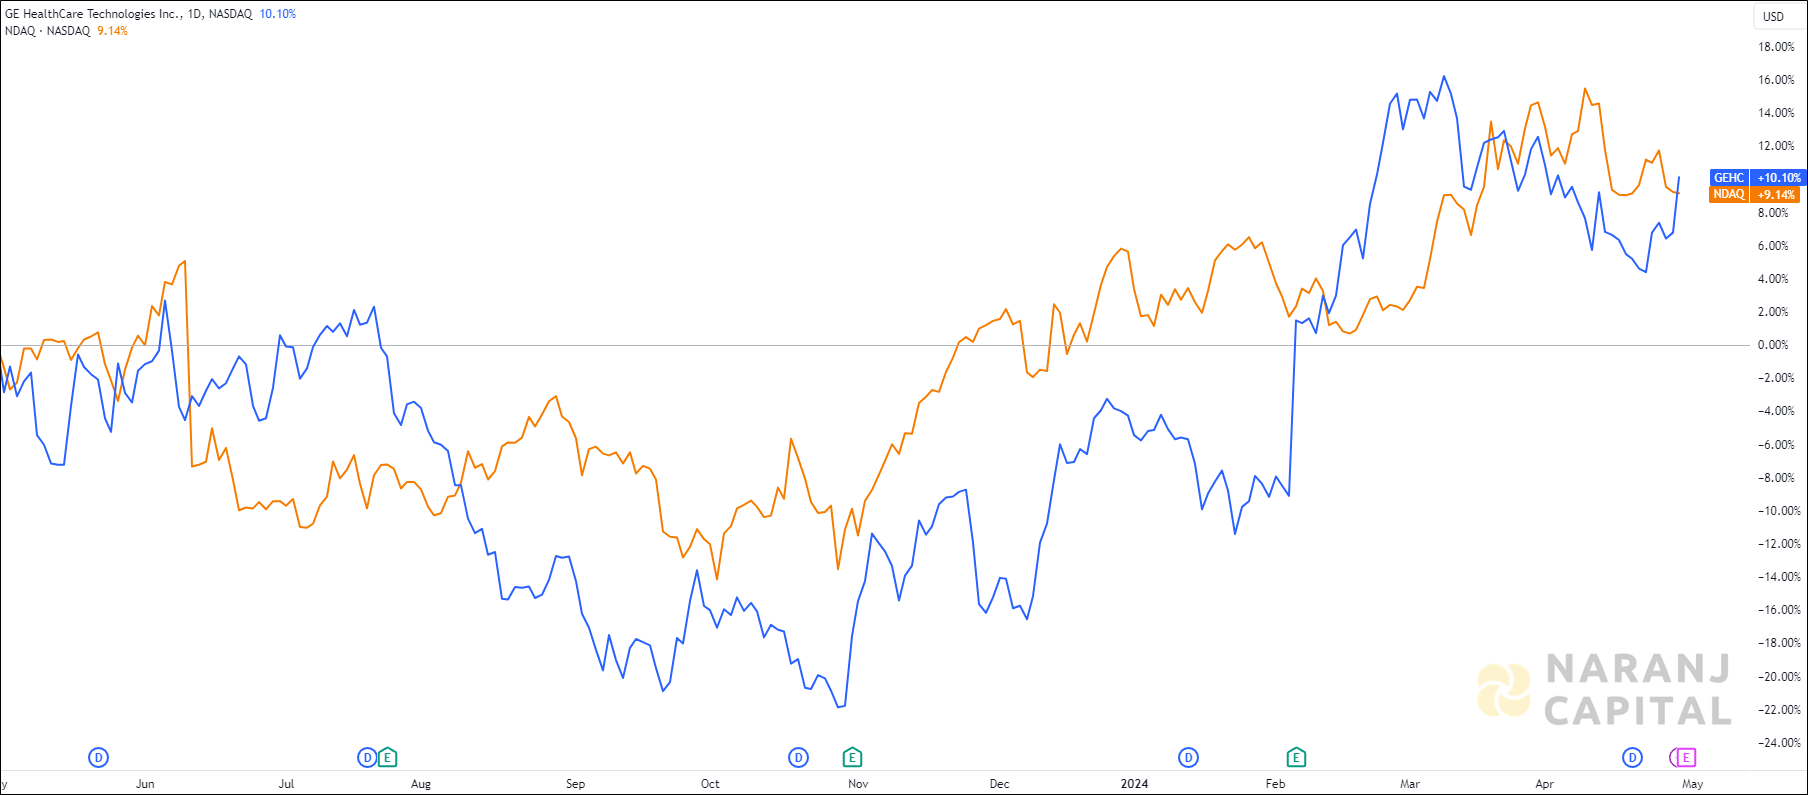
GEHC — NASDAQ —
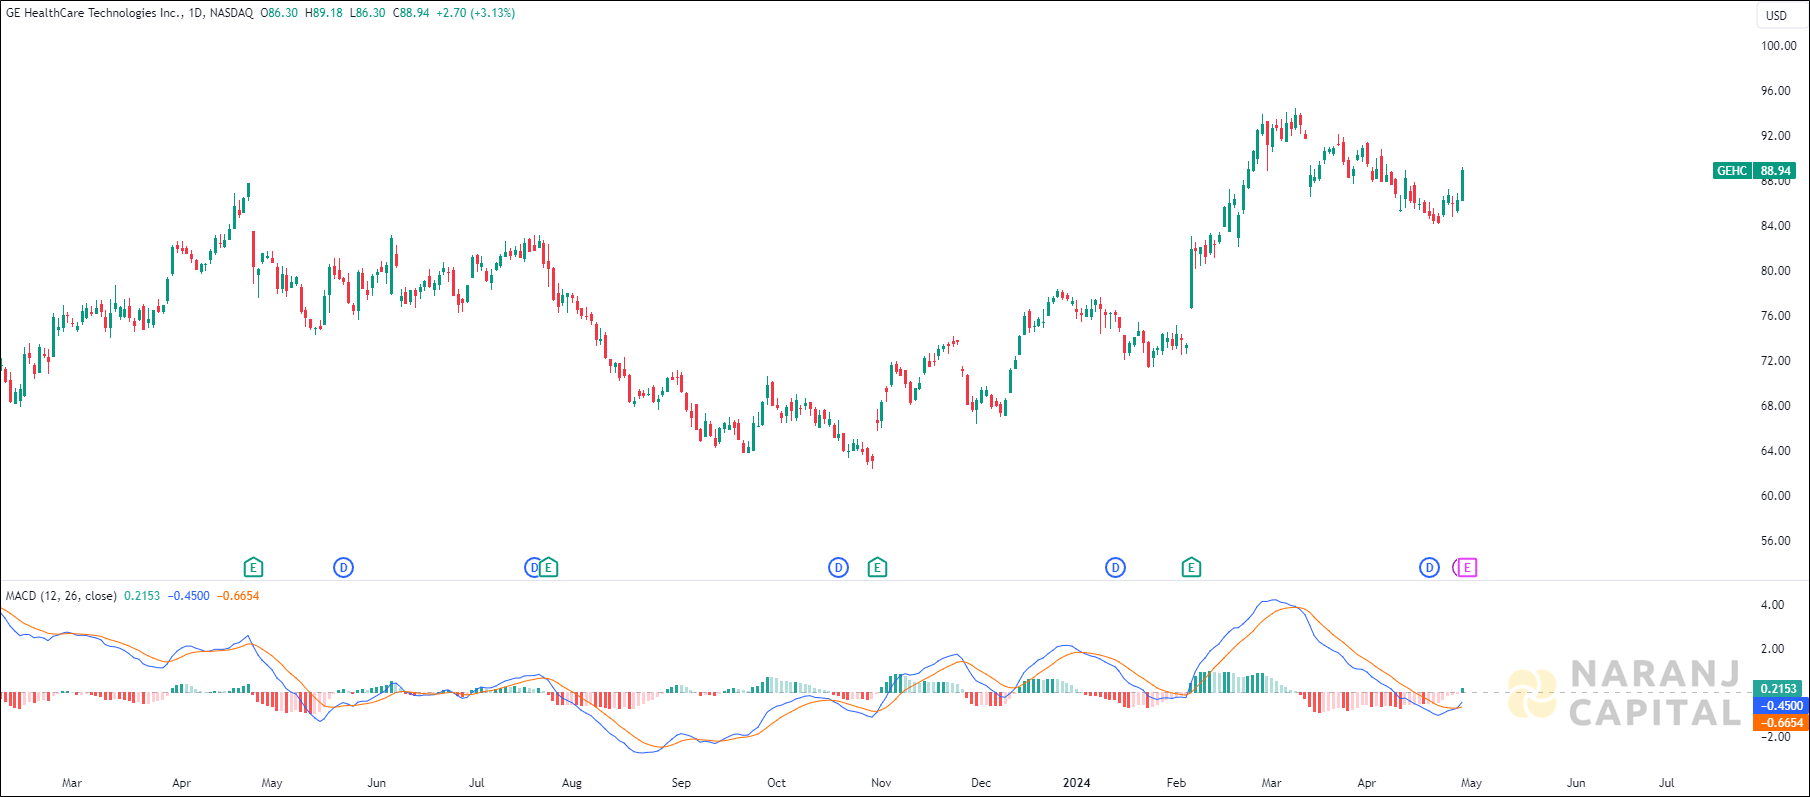
MACD line has just crossed the signal line from the below and a positive histogram chart is forming. This can be considered as a bullish signal.
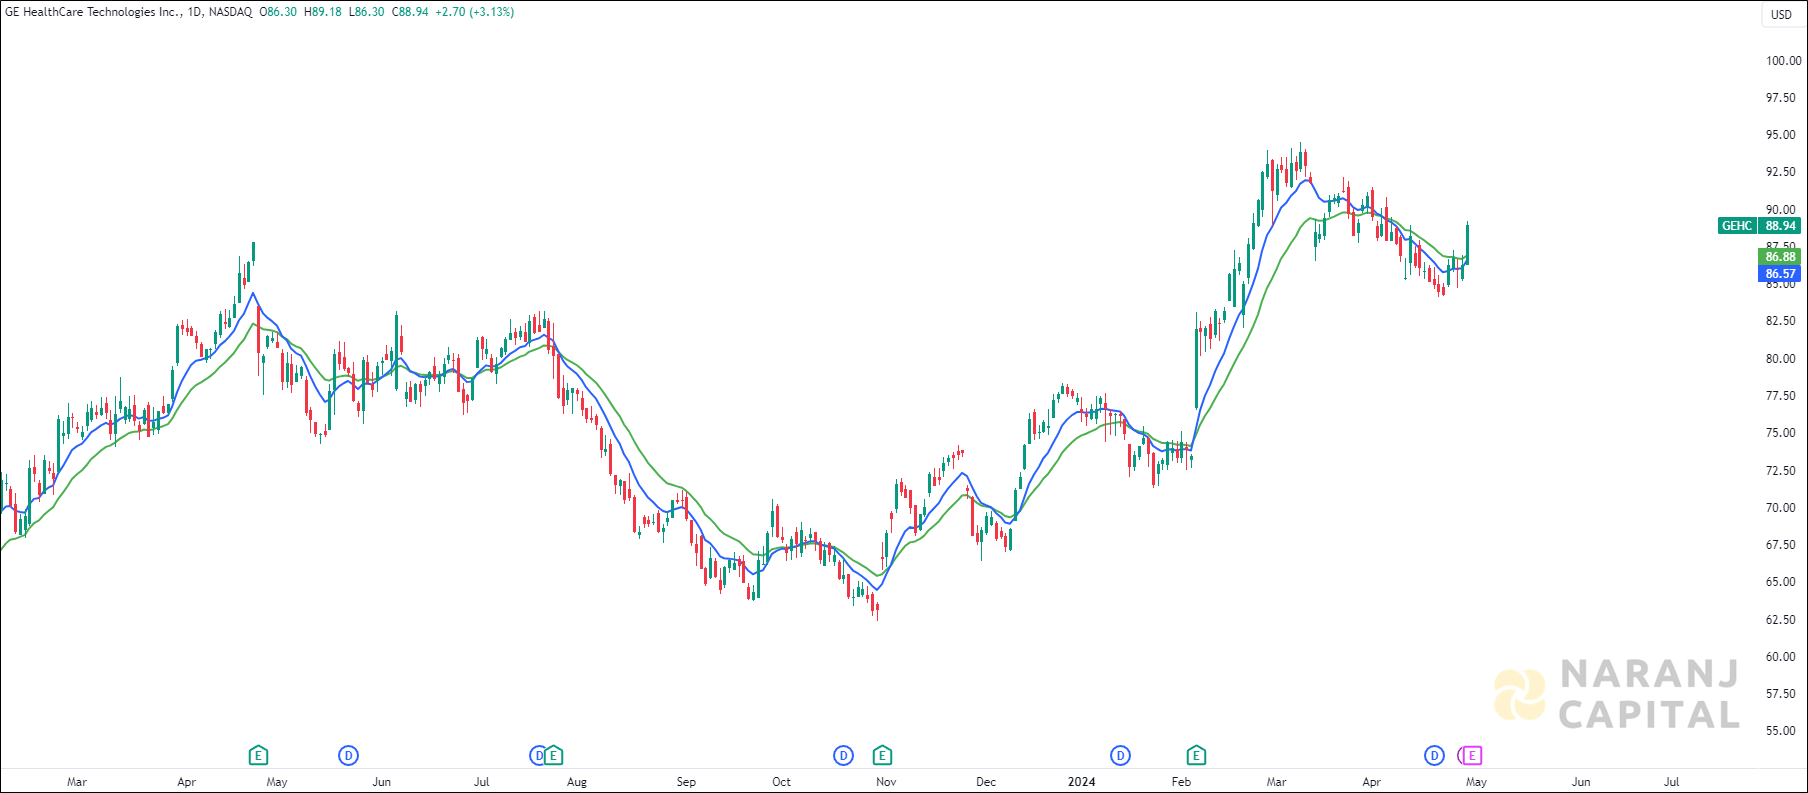
The short length exponential moving average (10 EMA) is about to cross the long length exponential moving average (20 EMA) from the below, generates bullish signal. Last day’s candle has closed above all these moving averages. This suggests buyers are taking interest in this stock.
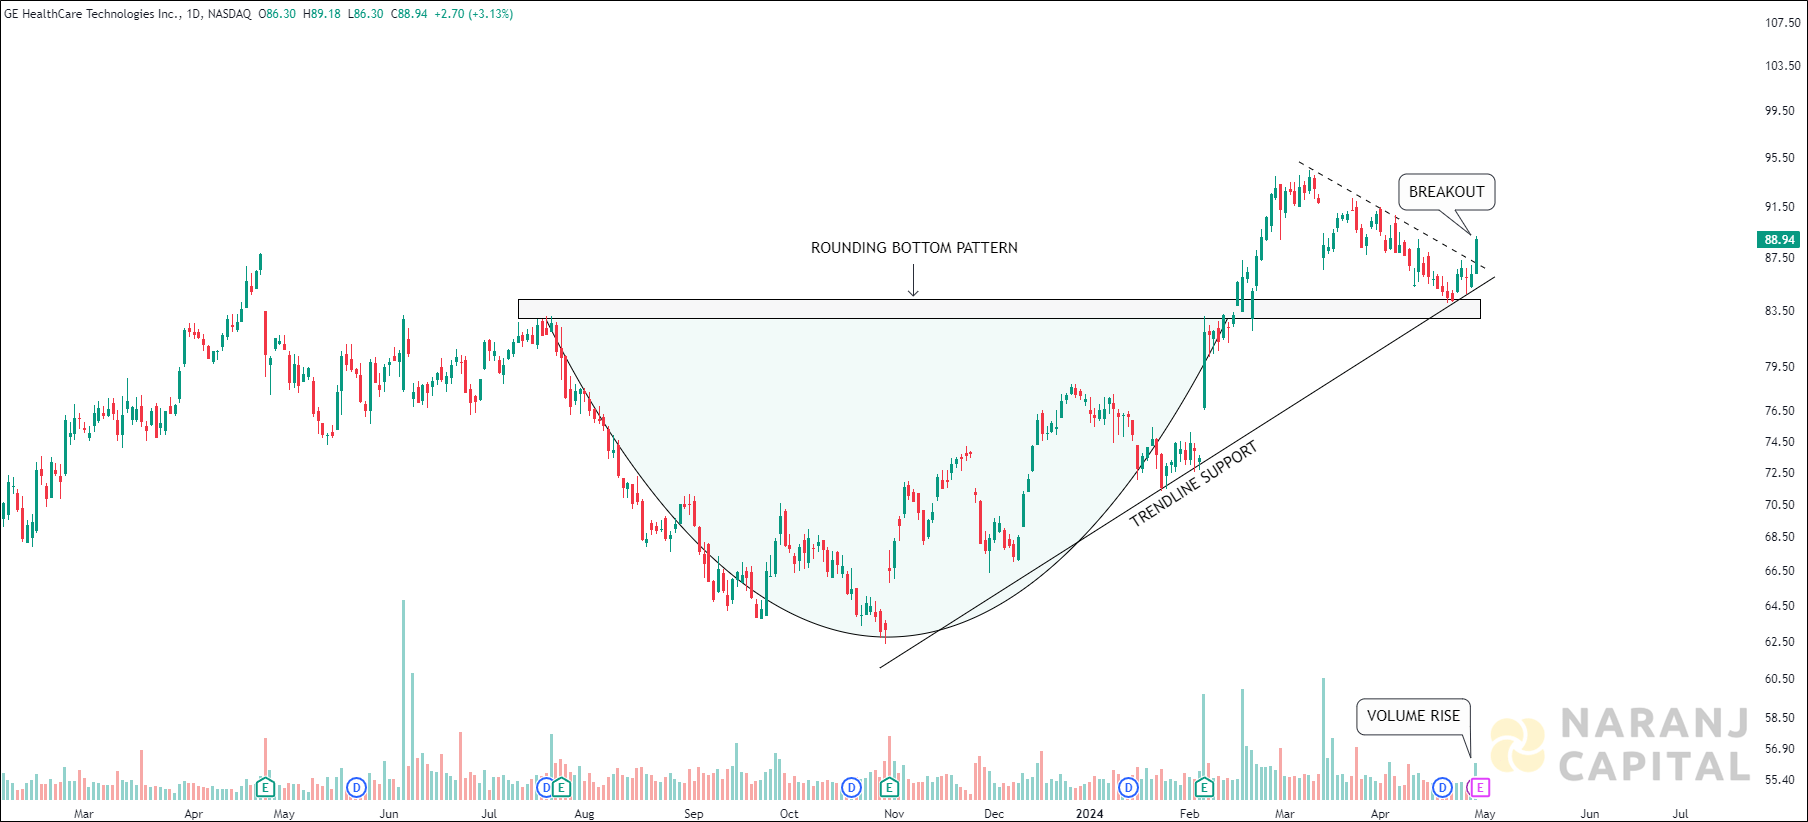
Based on our stock trading picks in US, GE HealthCare Technologies stock price target will be USD 93 - USD 95 in the next 12-14 trading sessions.


GEHC — NASDAQ —
MACD line has just crossed the signal line from the below and a positive histogram chart is forming. This can be considered as a bullish signal.
The short length exponential moving average (10 EMA) is about to cross the long length exponential moving average (20 EMA) from the below, generates bullish signal. Last day’s candle has closed above all these moving averages. This suggests buyers are taking interest in this stock.
Based on our stock trading picks in US, GE HealthCare Technologies stock price target will be USD 93 - USD 95 in the next 12-14 trading sessions.