
- Naranj Research Desk
- 🇸🇦 Saudi Stock Market
- 🇺🇸 USA Stock Market


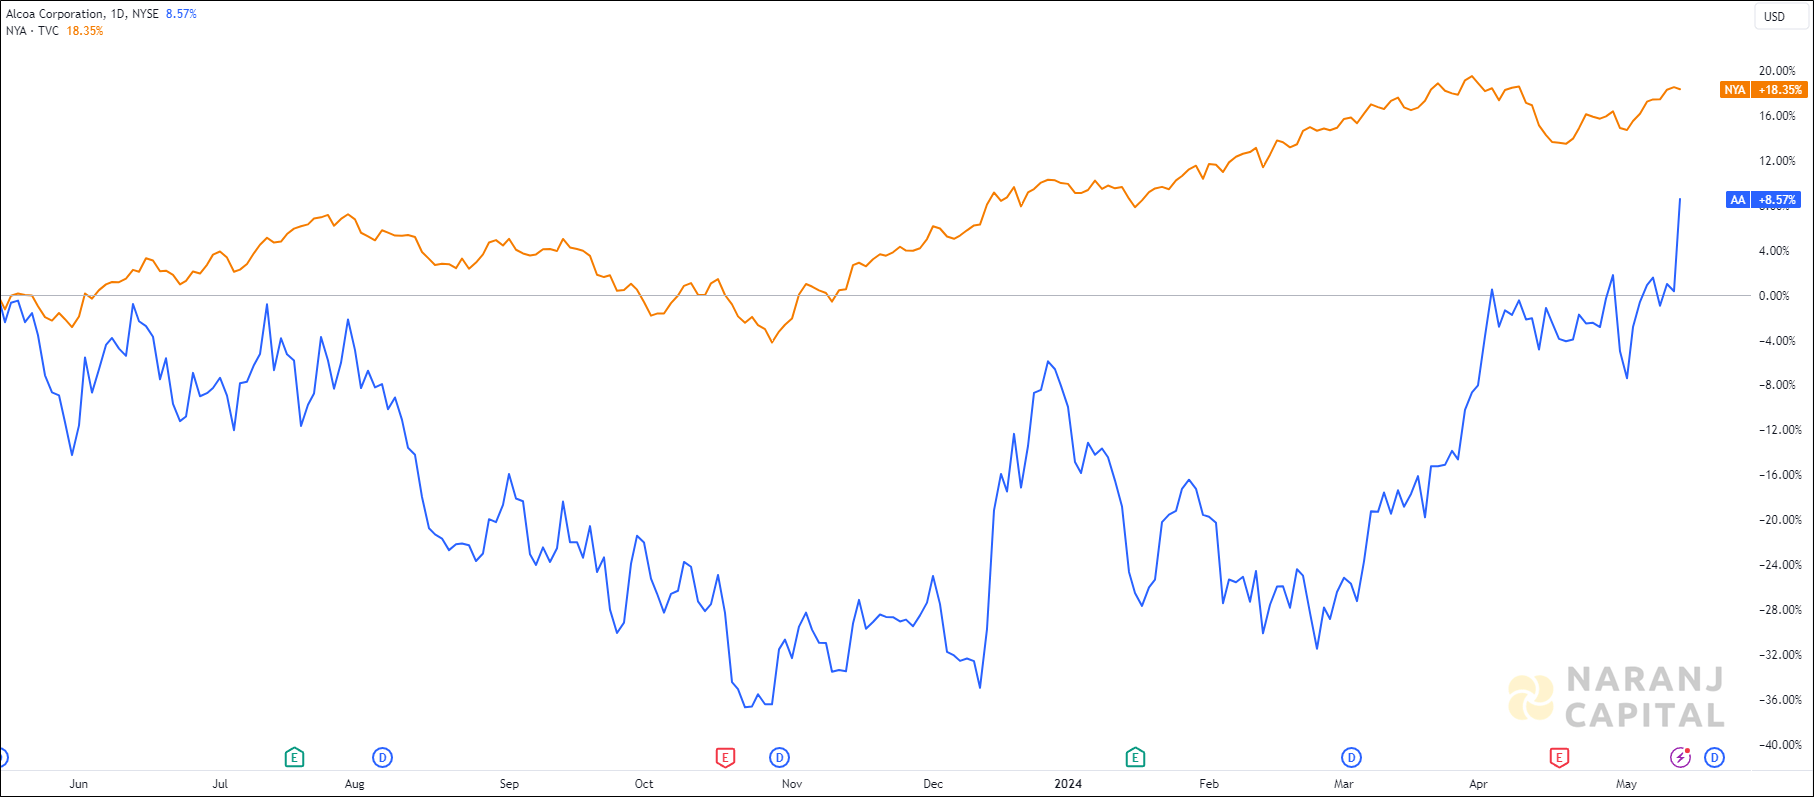
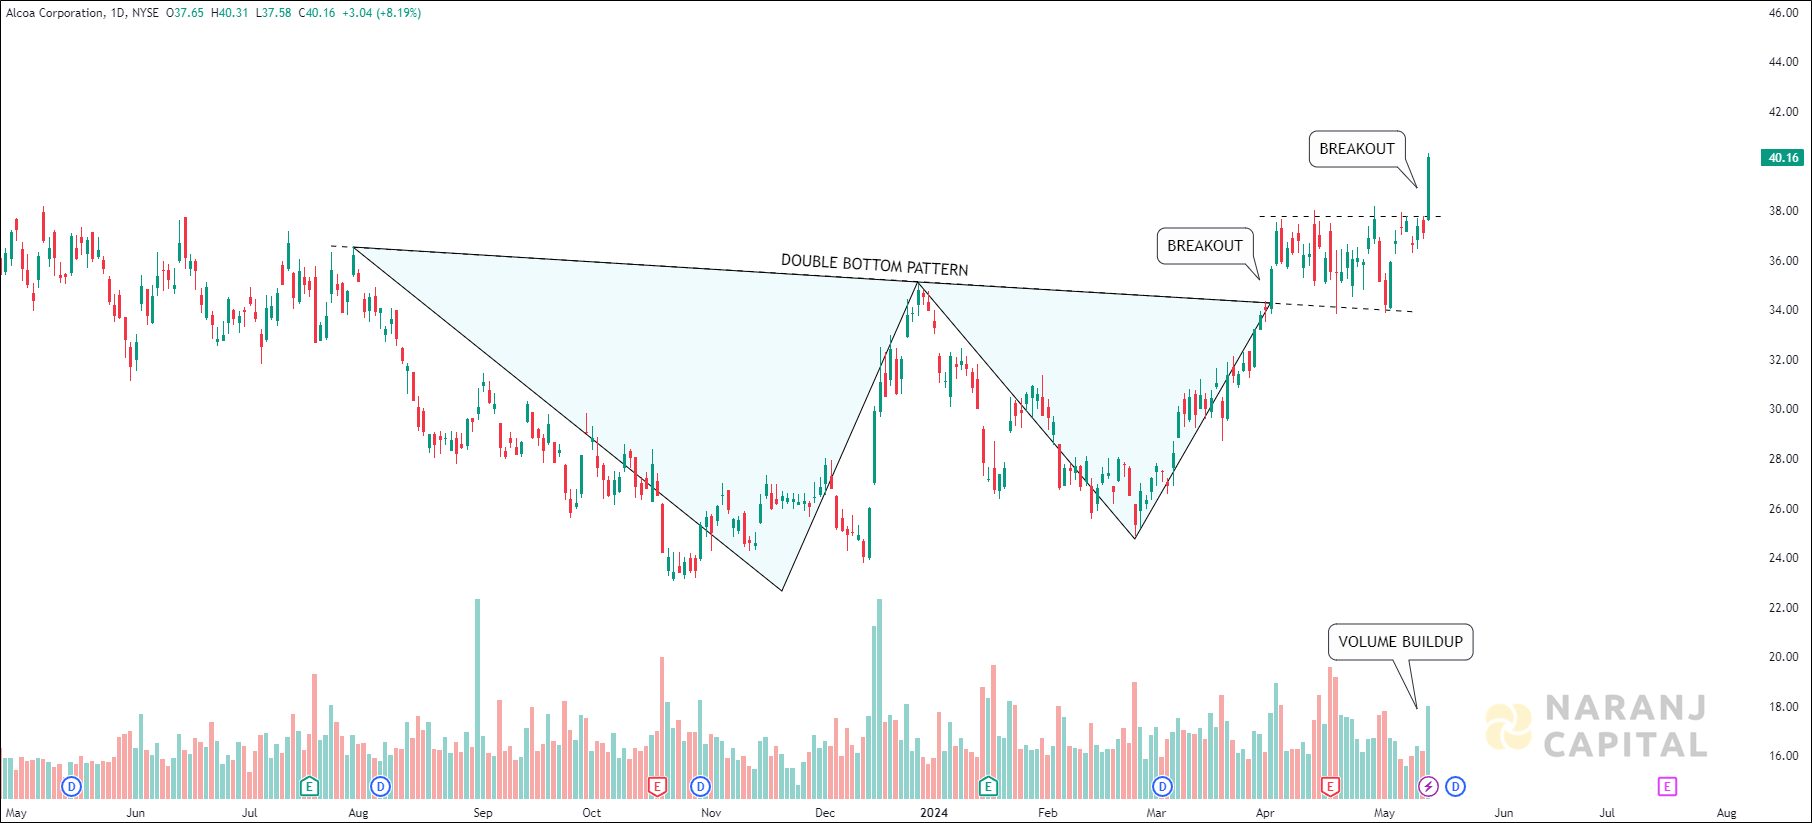
AA — NYSE —
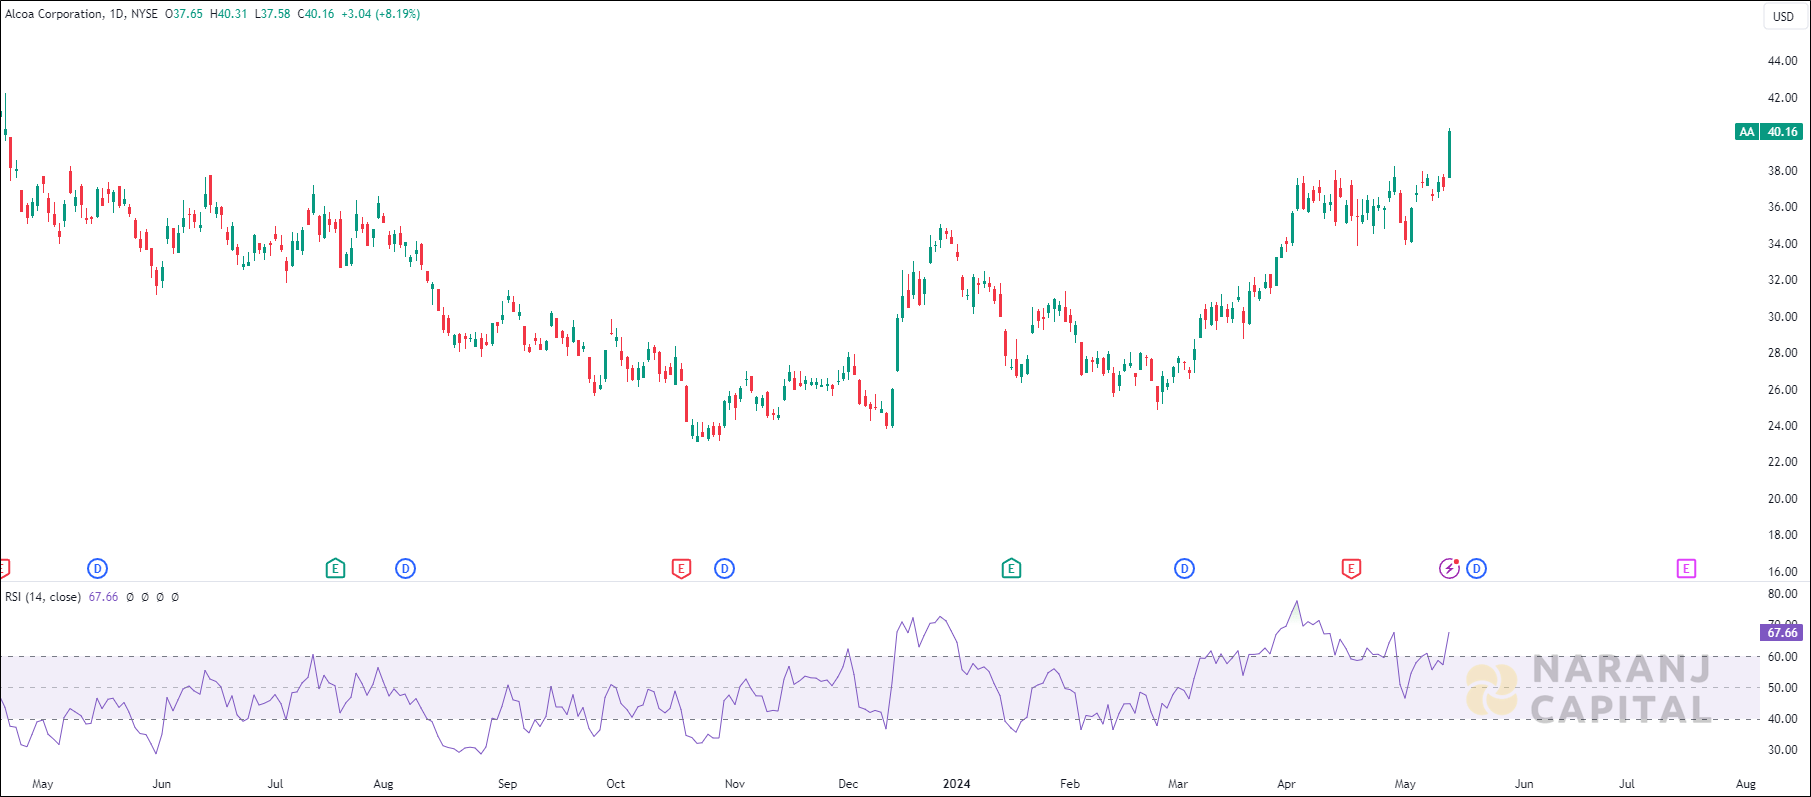
Current RSI of this stock is 67.66, which indicates the strength of buyers.
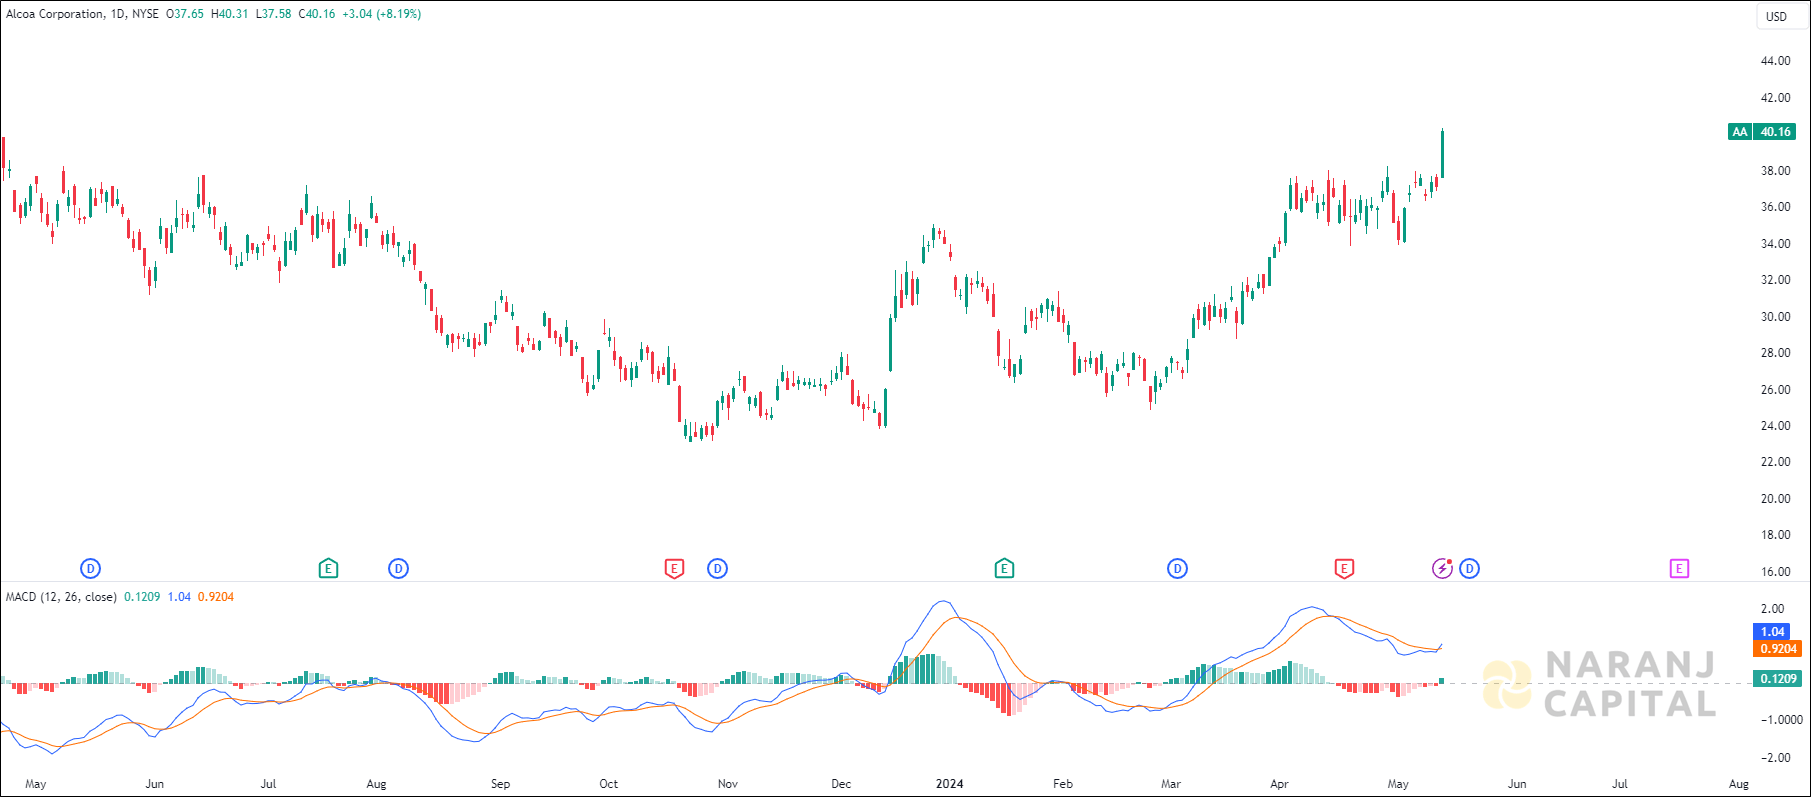
MACD line has just crossed the signal line from the below and a positive histogram chart is forming. This can be considered as a bullish signal.
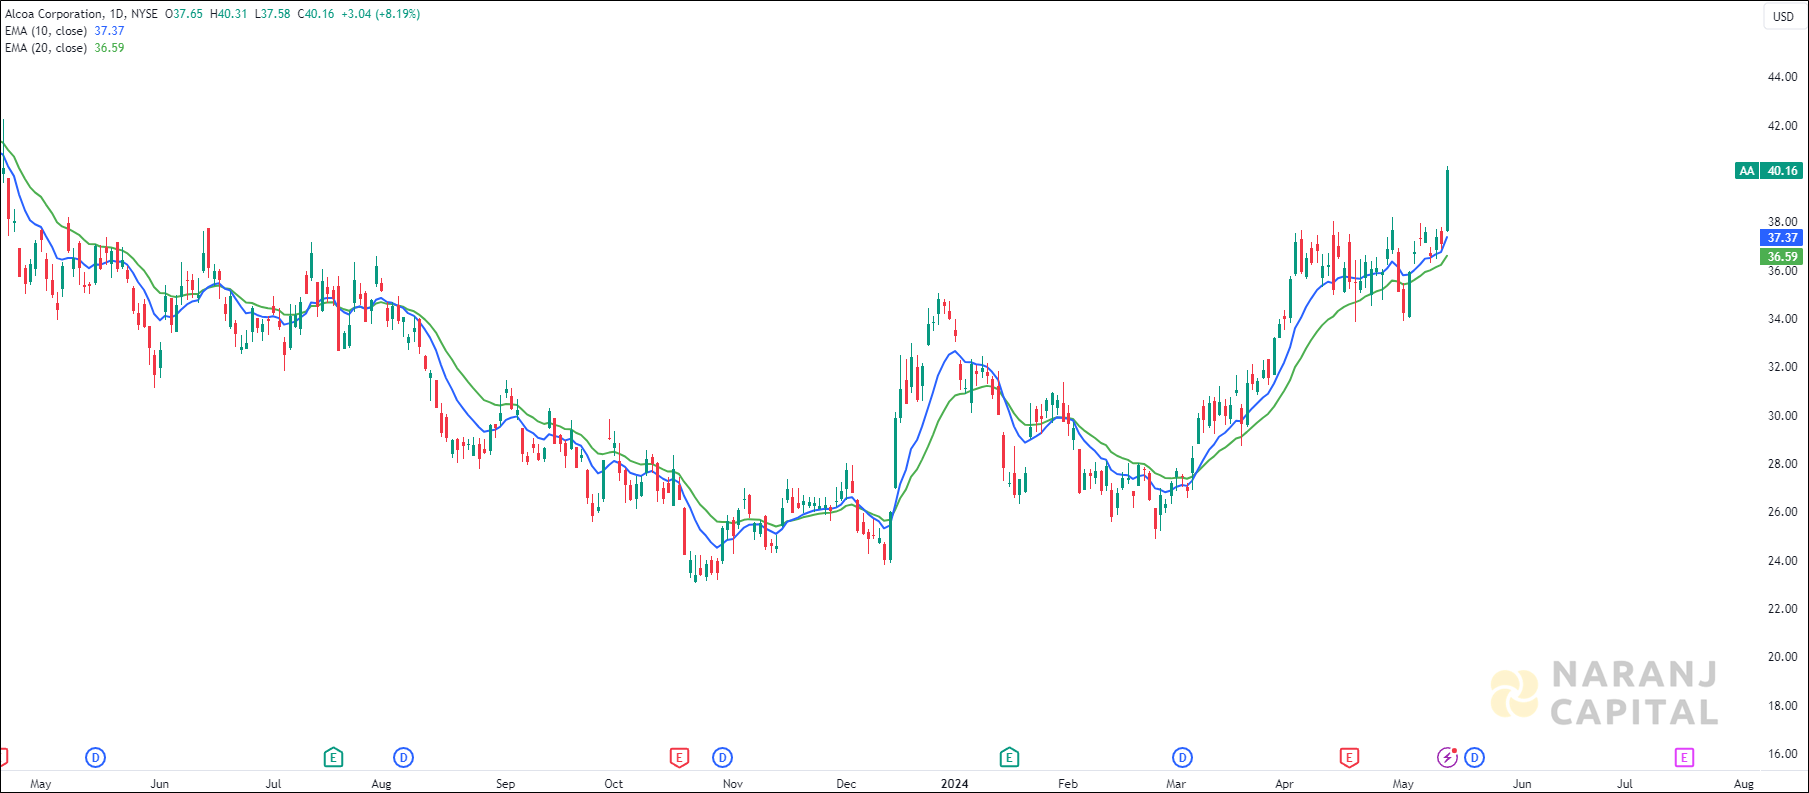
The short length exponential moving average (10 EMA) has crossed the long length moving average (20 EMA) from the below, generates bullish signal. Last day’s candle has closed above all these moving averages. This suggests buyers are taking interest in this stock.
Based on our short term US stock trading recommendations, Alcoa Corporation stock price target will be USD 42.5 - USD 43 in the next 12-14 trading sessions.


AA — NYSE —
Current RSI of this stock is 67.66, which indicates the strength of buyers.
MACD line has just crossed the signal line from the below and a positive histogram chart is forming. This can be considered as a bullish signal.
The short length exponential moving average (10 EMA) has crossed the long length moving average (20 EMA) from the below, generates bullish signal. Last day’s candle has closed above all these moving averages. This suggests buyers are taking interest in this stock.
Based on our short term US stock trading recommendations, Alcoa Corporation stock price target will be USD 42.5 - USD 43 in the next 12-14 trading sessions.