- Naranj Research Desk
- 🇸🇦 Saudi Stock Market
- 🇺🇸 USA Stock Market


| Metrics | Q2 FY25 | Q1 FY25 | Q2 FY24 | QoQ Change | YoY Change |
|---|---|---|---|---|---|
| Revenue ($ million) | 401.2 | 326 | 335.8 | 23.10% | 19.50% |
| Gross Margin (%) | 26.7 | 27.2 | 20.4 | -0.5pp | +6.3pp |
| Operating Loss ($ million) | -3.5 | -19.1 | -23.1 | 15.6 | 19.6 |
| Net Loss ($ million) | -42.6 | -23.8 | -61.8 | -18.8 | 19.2 |
| GAAP EPS ($) | -0.18 | -0.1 | -0.27 | -0.08 | 0.09 |
Earnings & Revenue: Q2 2025 EPS of $0.10 beat estimates by 900%; revenue $401.2M, up 19.5% YoY and 6.63% above expectations.
Profitability: Operating income turned positive at $28.6M, compared to a loss in Q2 2024.
Strategic Partnership & Expansion: Partnered with Oracle to power AI data centers; plans to double manufacturing capacity by end of next year.
Guidance: 2025 revenue forecast $1.65B–$1.85B; non-GAAP gross margin target 29%; positive cash flow from operations expected.
BE — NASDAQ —
| Indicator | Value | Zone |
|---|---|---|
| RSI-14 | 72.01 | Overbought |
| CCI-14 | 144.33 | Overbought |
| ROC (+/-) | 31.35 | Positive |
| Stochastic %K | 58.66 | Neutral |
| William %R | -18.4 | Neutral |
| EMA | Value | Stock Position |
|---|---|---|
| 5 EMA | 112.05 | Above |
| 10 EMA | 109.16 | Above |
| 20 EMA | 105.02 | Above |
| 50 EMA | 96.27 | Above |
| 100 EMA | 89.22 | Above |
| 200 EMA | 78.96 | Above |
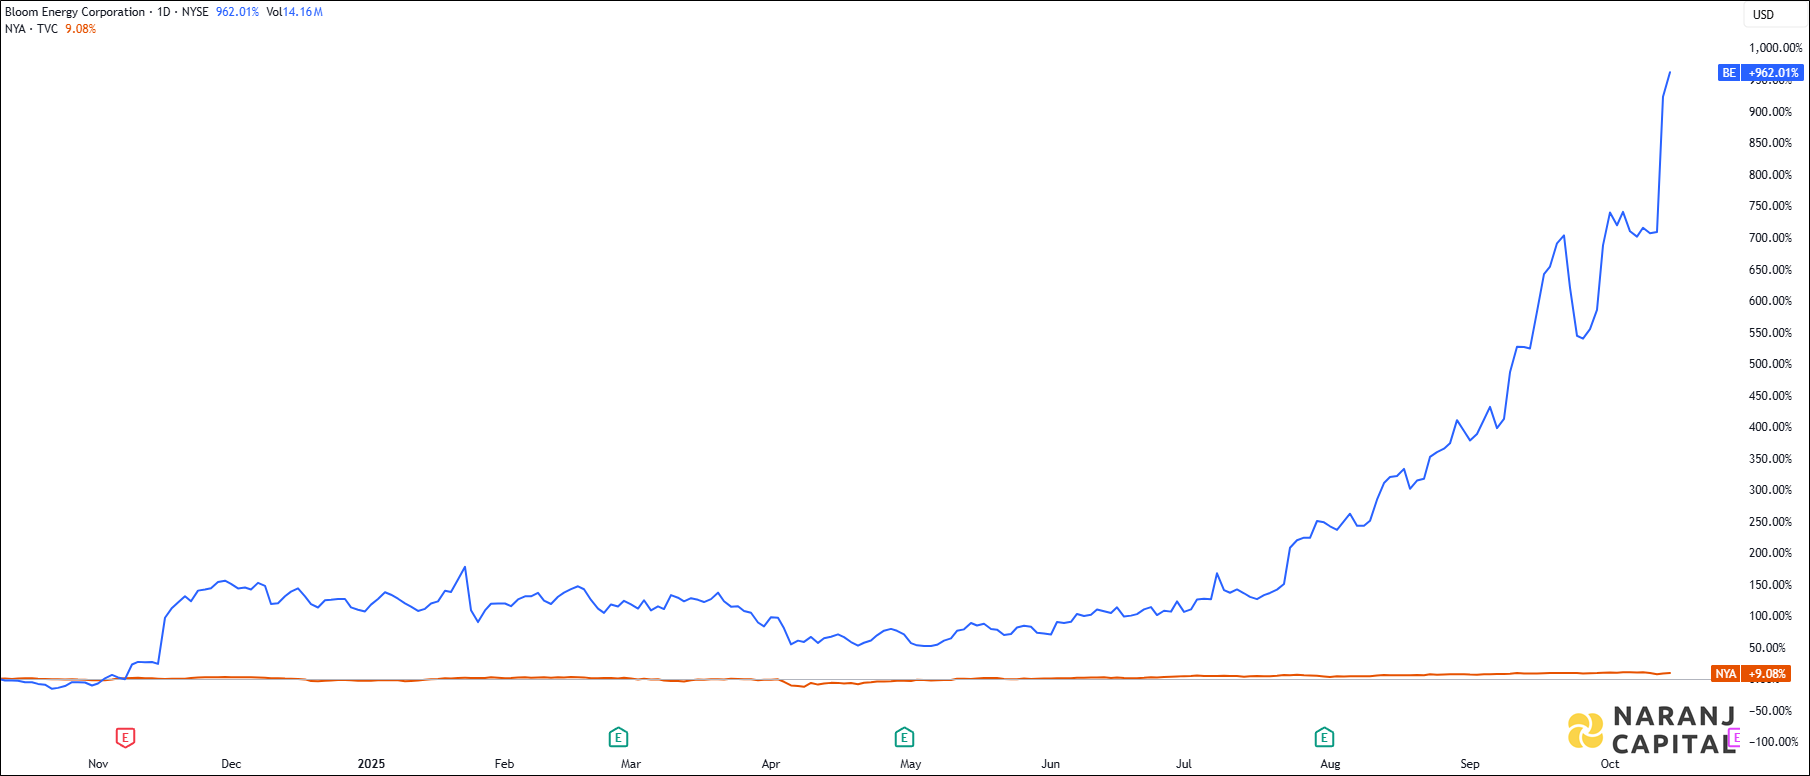
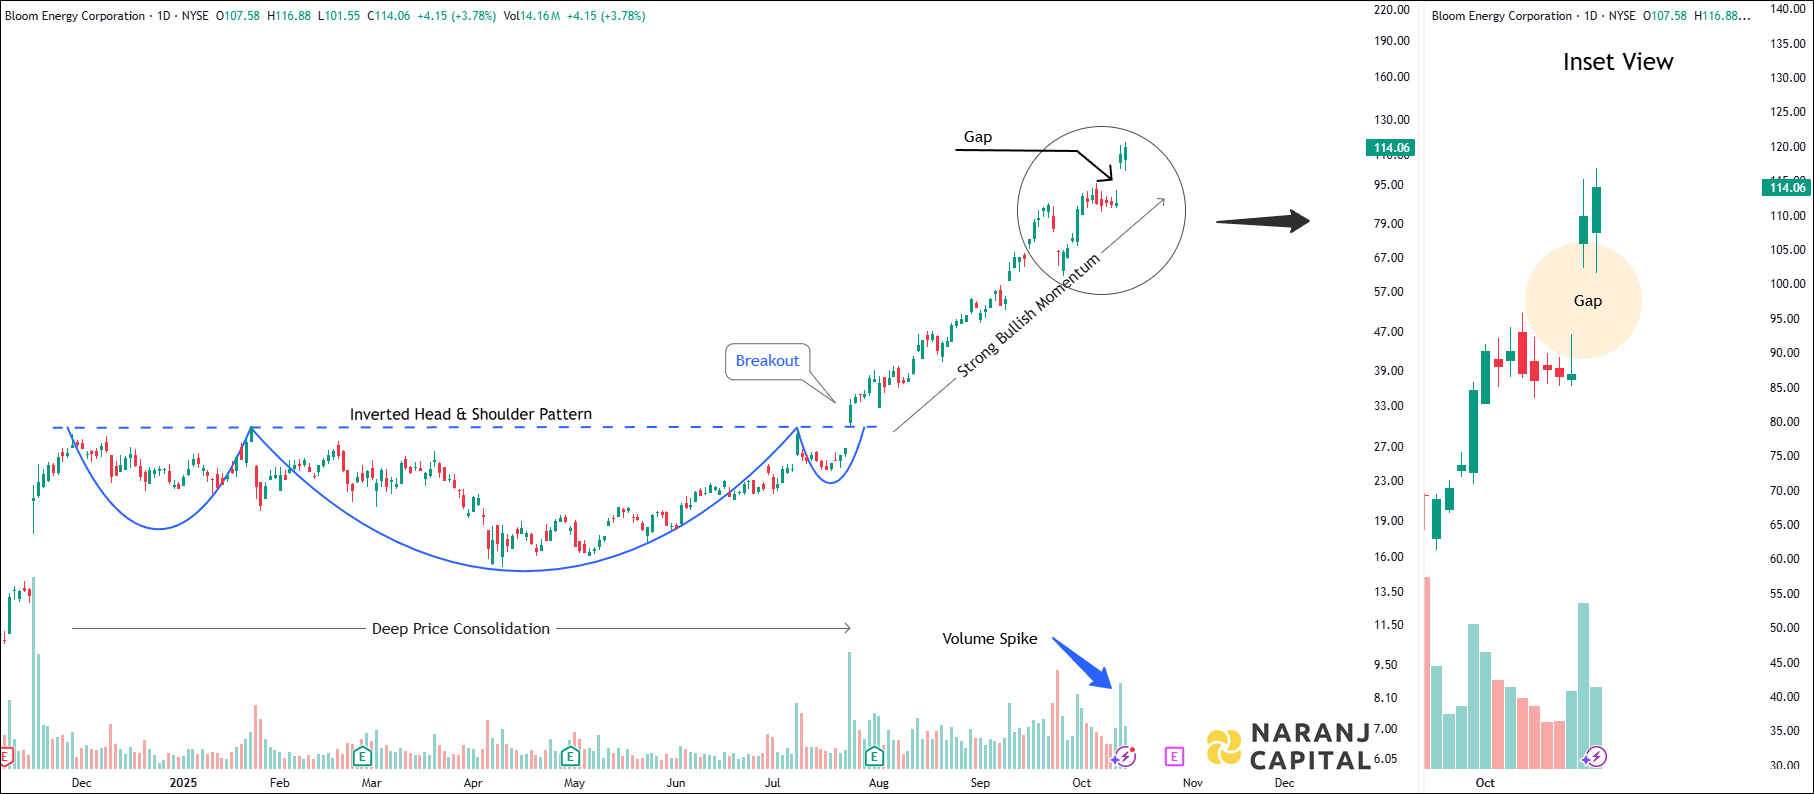
Based on our swing trading in the US stock market, Bloom Energy Corporation stock price target will be USD 125 - USD 128 in the next 14-15 trading sessions.


| Metrics | Q2 FY25 | Q1 FY25 | Q2 FY24 | QoQ Change | YoY Change |
|---|---|---|---|---|---|
| Revenue ($ million) | 401.2 | 326 | 335.8 | 23.10% | 19.50% |
| Gross Margin (%) | 26.7 | 27.2 | 20.4 | -0.5pp | +6.3pp |
| Operating Loss ($ million) | -3.5 | -19.1 | -23.1 | 15.6 | 19.6 |
| Net Loss ($ million) | -42.6 | -23.8 | -61.8 | -18.8 | 19.2 |
| GAAP EPS ($) | -0.18 | -0.1 | -0.27 | -0.08 | 0.09 |
Earnings & Revenue: Q2 2025 EPS of $0.10 beat estimates by 900%; revenue $401.2M, up 19.5% YoY and 6.63% above expectations.
Profitability: Operating income turned positive at $28.6M, compared to a loss in Q2 2024.
Strategic Partnership & Expansion: Partnered with Oracle to power AI data centers; plans to double manufacturing capacity by end of next year.
Guidance: 2025 revenue forecast $1.65B–$1.85B; non-GAAP gross margin target 29%; positive cash flow from operations expected.
BE — NASDAQ —
| Indicator | Value | Zone |
|---|---|---|
| RSI-14 | 72.01 | Overbought |
| CCI-14 | 144.33 | Overbought |
| ROC (+/-) | 31.35 | Positive |
| Stochastic %K | 58.66 | Neutral |
| William %R | -18.4 | Neutral |
| EMA | Value | Stock Position |
|---|---|---|
| 5 EMA | 112.05 | Above |
| 10 EMA | 109.16 | Above |
| 20 EMA | 105.02 | Above |
| 50 EMA | 96.27 | Above |
| 100 EMA | 89.22 | Above |
| 200 EMA | 78.96 | Above |
Based on our swing trading in the US stock market, Bloom Energy Corporation stock price target will be USD 125 - USD 128 in the next 14-15 trading sessions.