- Naranj Research Desk
- 🇸🇦 Saudi Stock Market
- 🇺🇸 USA Stock Market


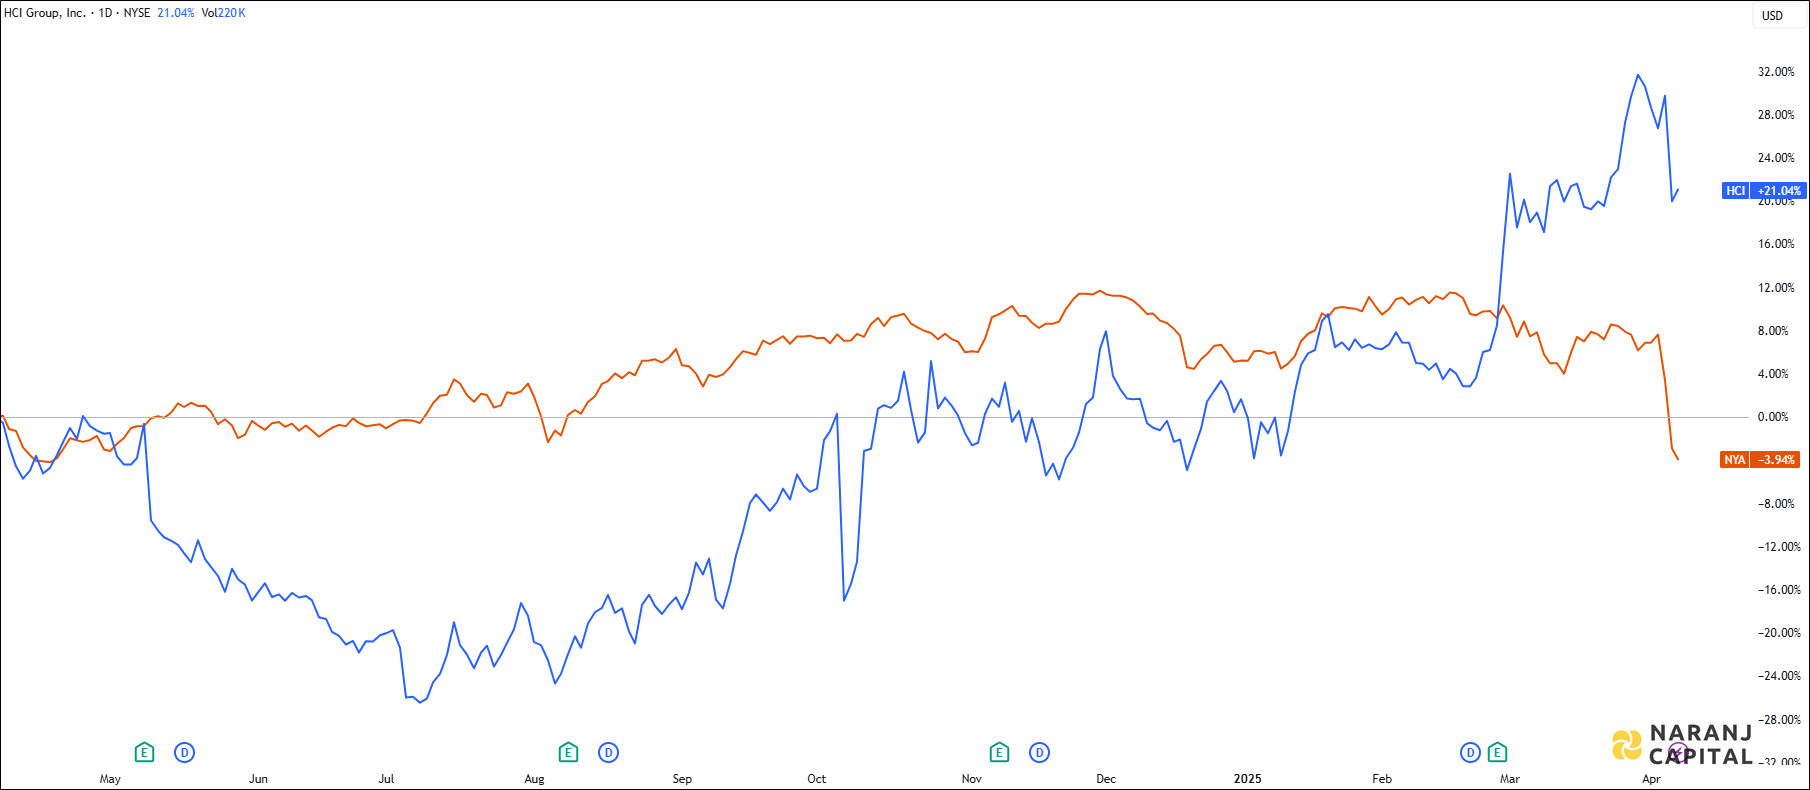
HCI — NYSE —
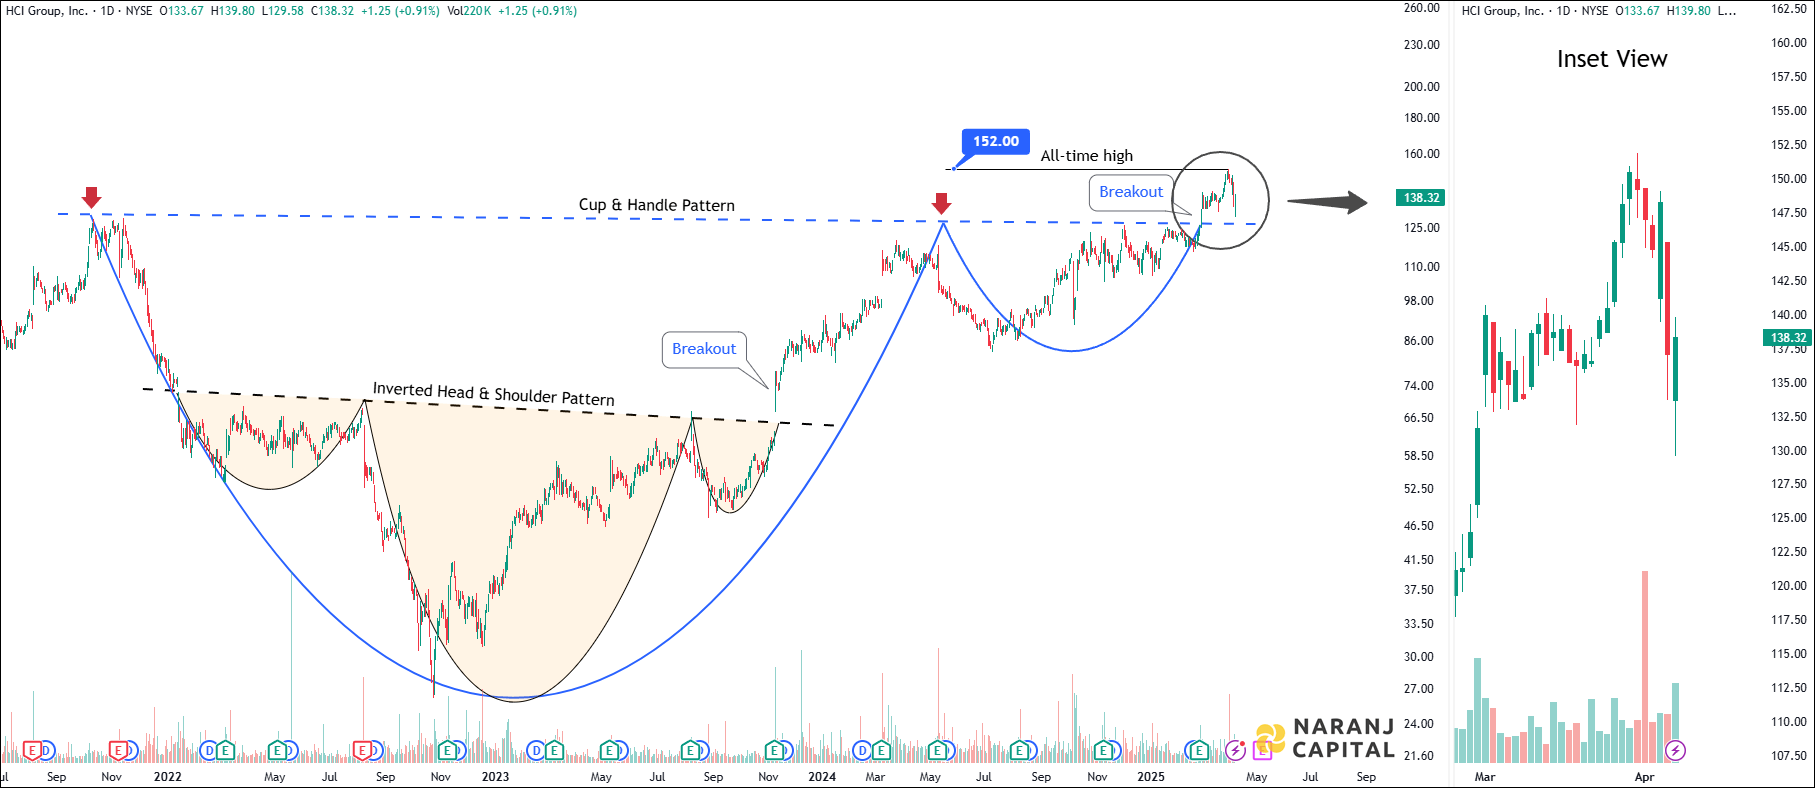
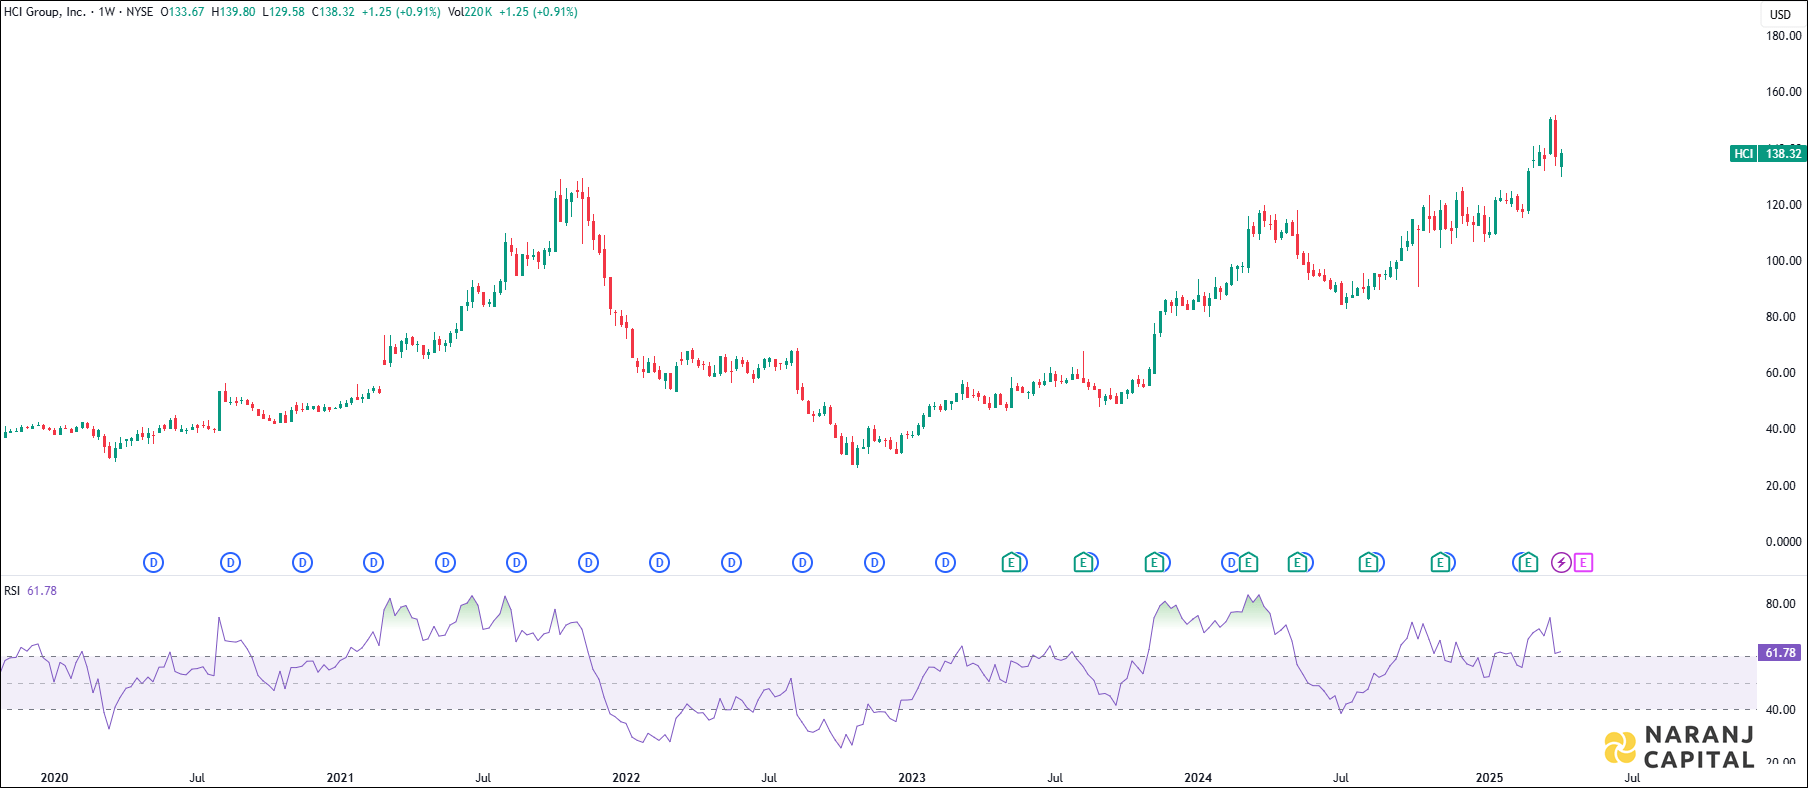
Current RSI of this stock is 61.78 on the weekly chart, which indicates the strength of buyers.
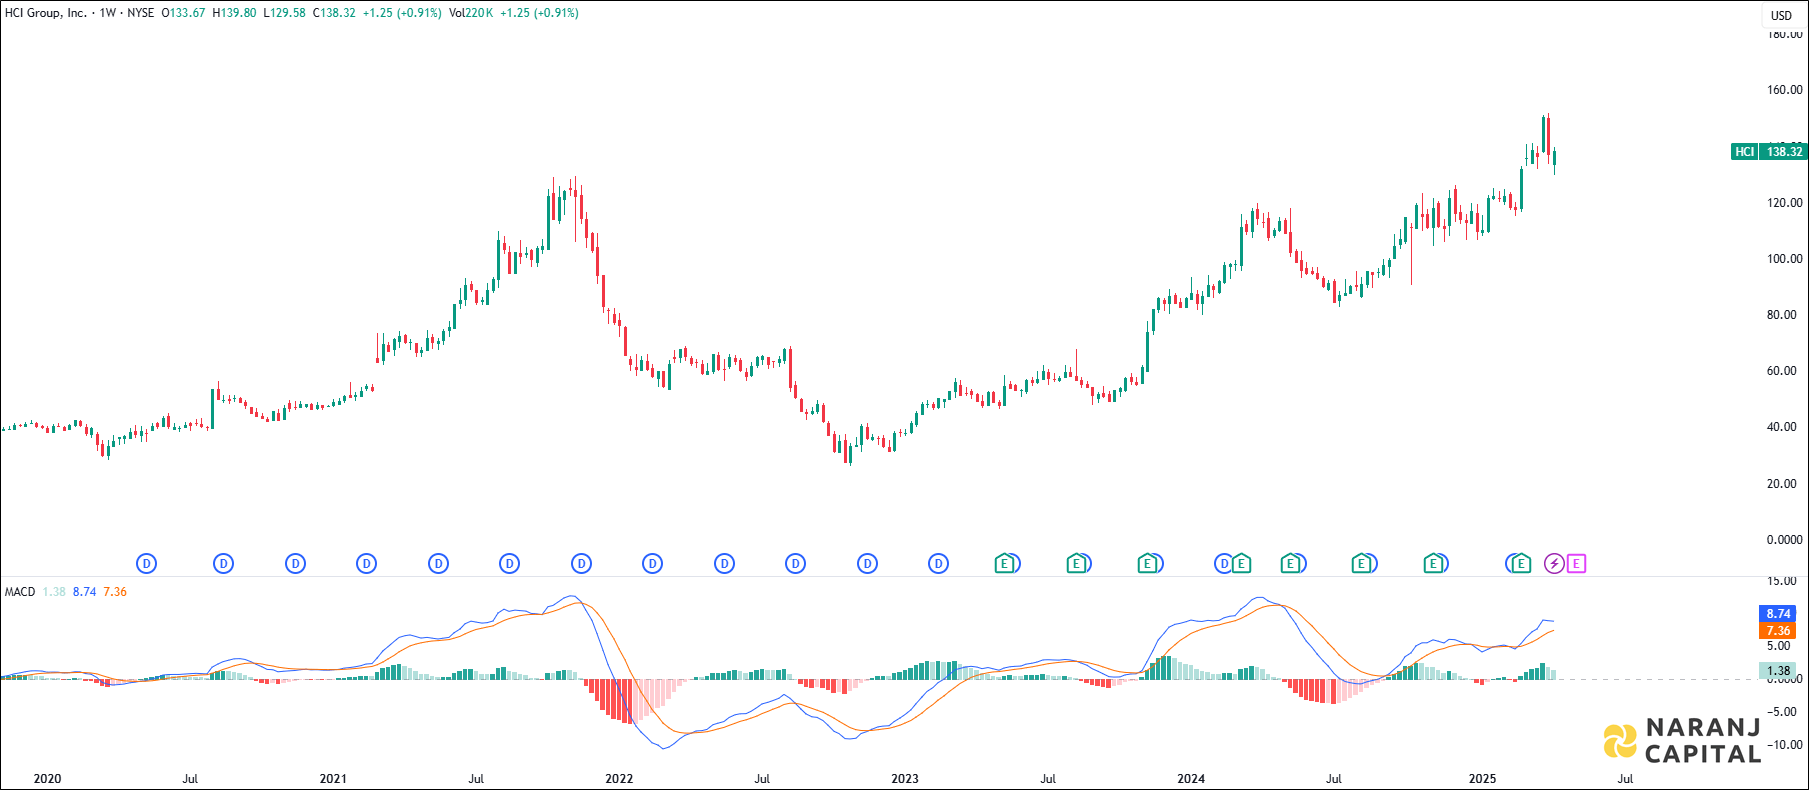
MACD line has crossed the signal line from the below, generates bullish signal.
The short length exponential moving average (10 EMA) has crossed the long length exponential moving average (20 EMA) from the below, generates bullish signal.
Based on our swing trading strategies for US stocks, HCI Group stock price target will be USD 148 - USD 150 in the next 15-16 trading sessions.


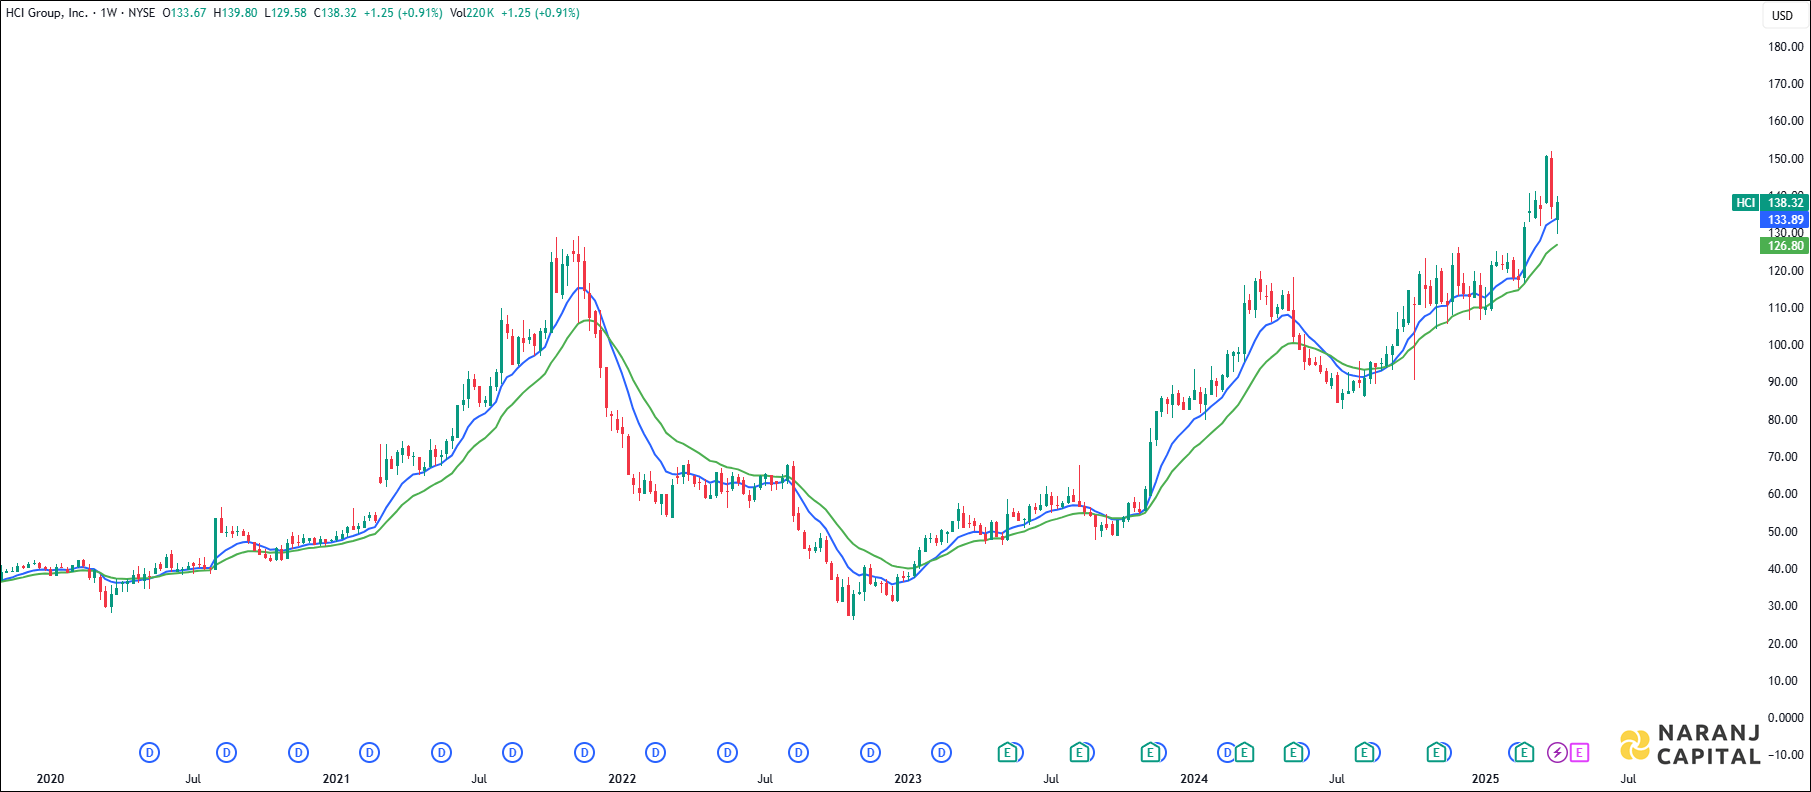
HCI — NYSE —
Current RSI of this stock is 61.78 on the weekly chart, which indicates the strength of buyers.
MACD line has crossed the signal line from the below, generates bullish signal.
The short length exponential moving average (10 EMA) has crossed the long length exponential moving average (20 EMA) from the below, generates bullish signal.
Based on our swing trading strategies for US stocks, HCI Group stock price target will be USD 148 - USD 150 in the next 15-16 trading sessions.