- Naranj Research Desk
- 🇸🇦 Saudi Stock Market
- 🇺🇸 USA Stock Market


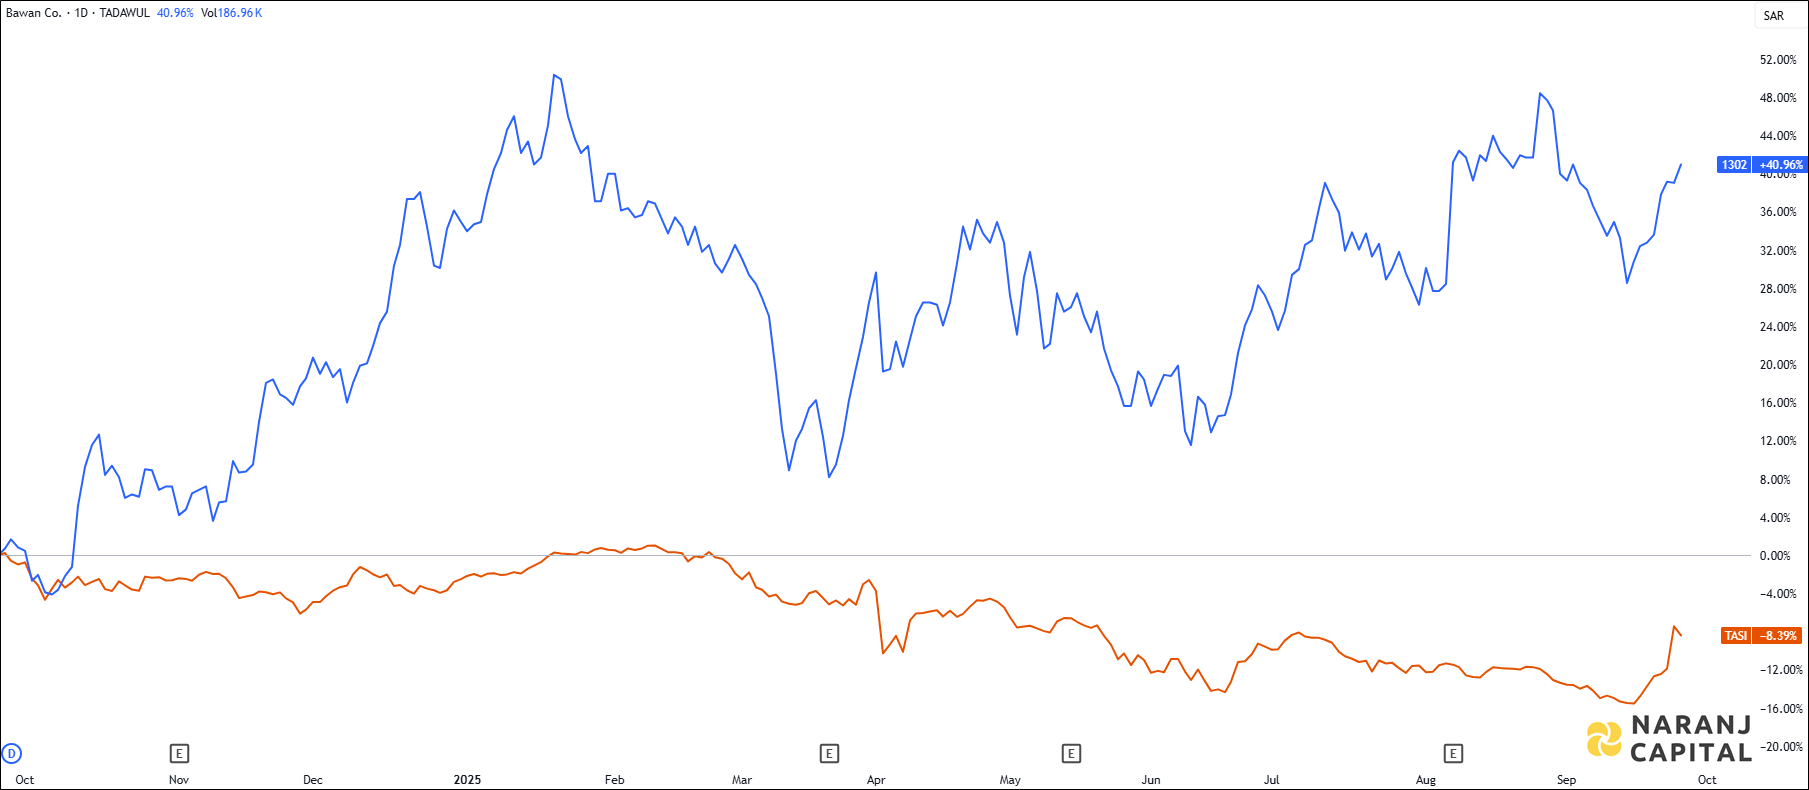
BAWAN — TASI —
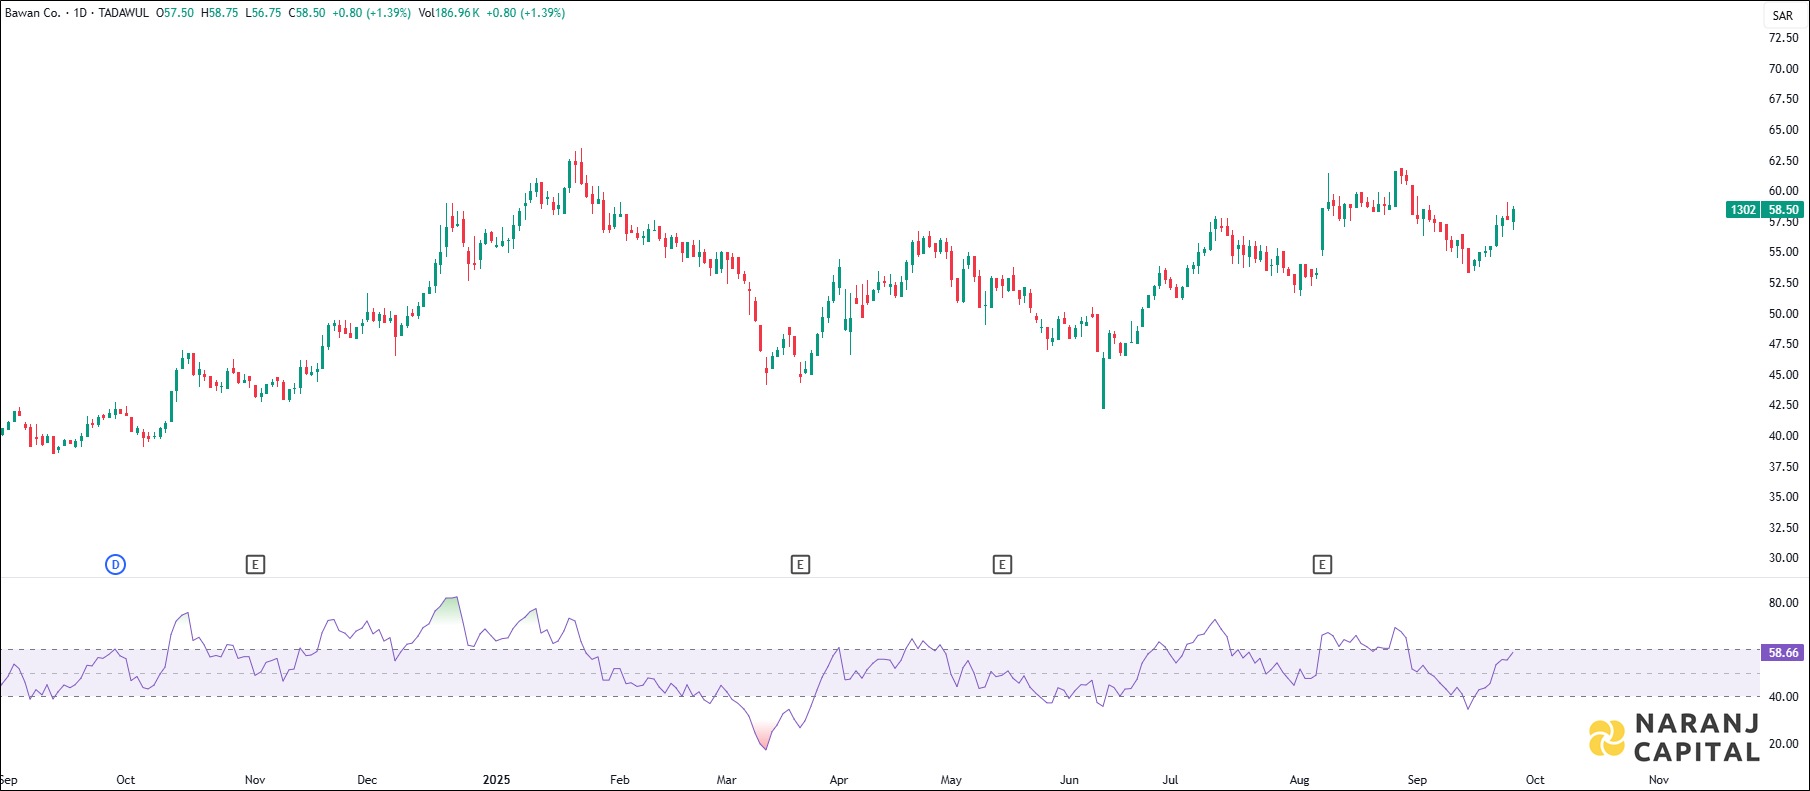
A bullish signal is generated as the K line (blue) crosses over the D line (orange) from below, indicating a reversal from oversold conditions.
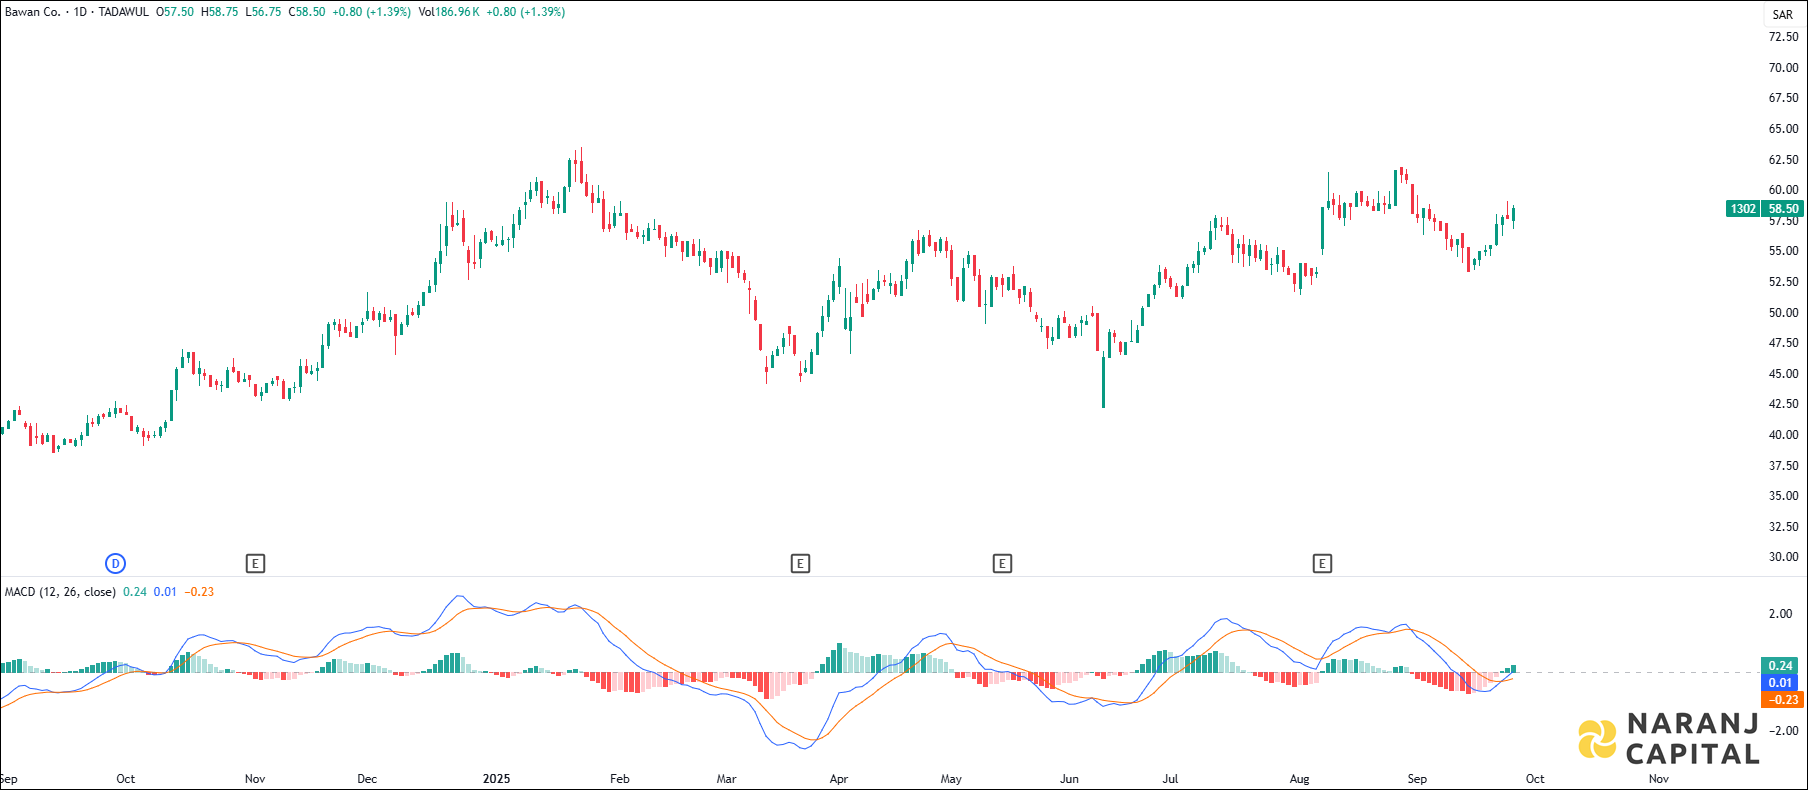
MACD line has just crossed the signal line from the below, generates bullish signal.
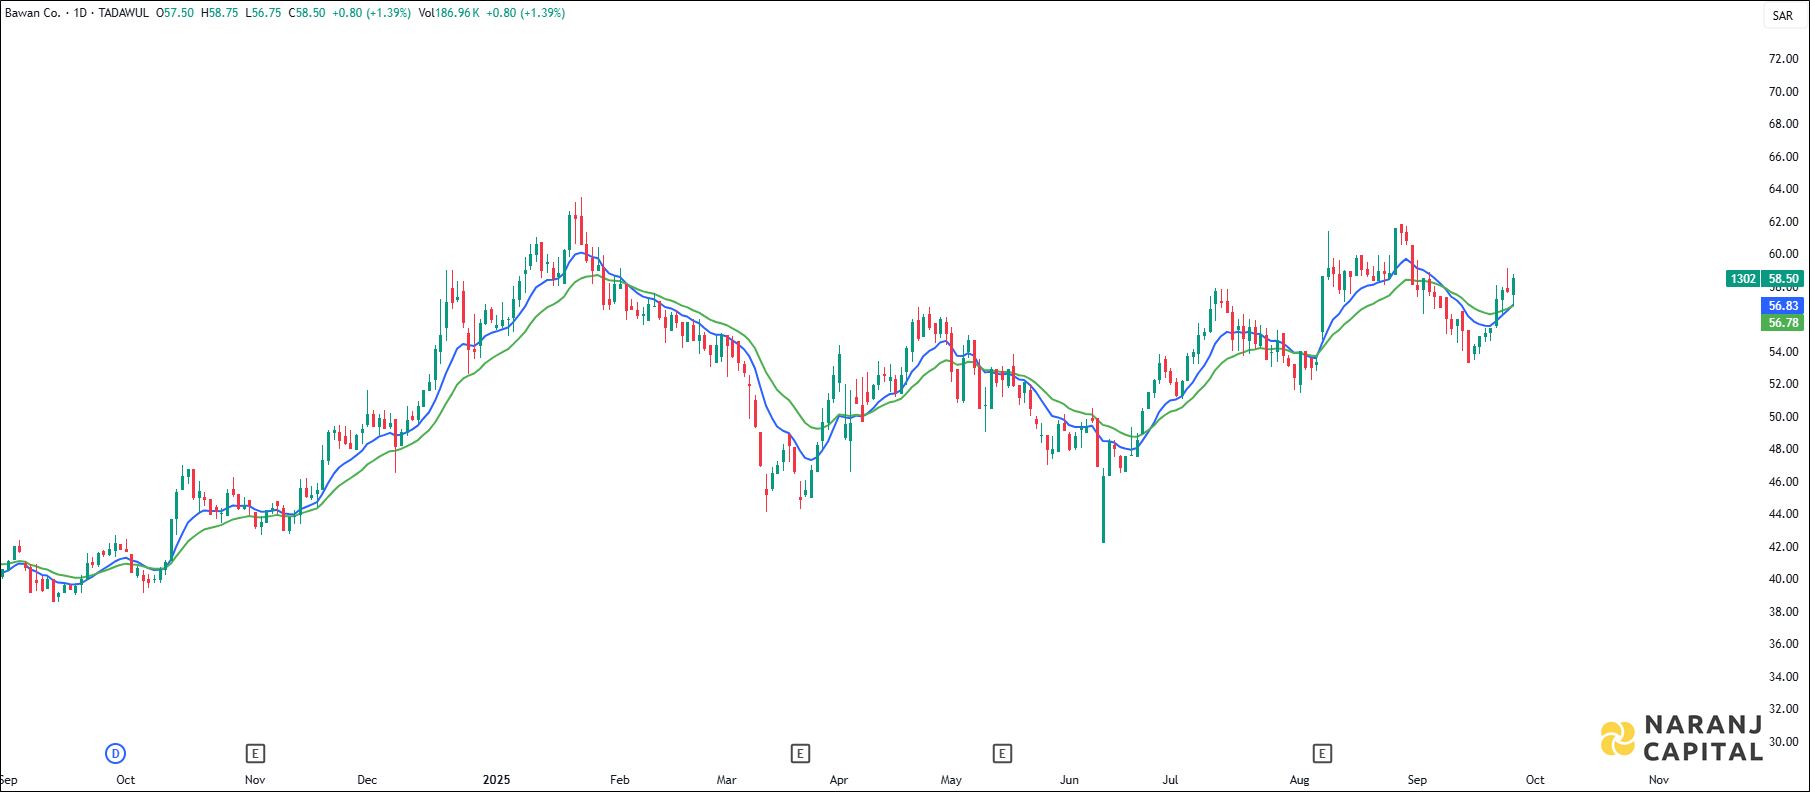
The short length exponential moving average (10 EMA) has just crossed the long length Exponential moving average (20 EMA) from the below, generates bullish signal. Last day’s candle has closed above all these moving averages. This suggests buyers are taking interest in this stock.
Based on our Saudi trading advice, Bawan Company stock price target will be SAR 62 - SAR 63 in the next 14-15 trading sessions.